
U.S. Labor Market Steadies in Q3 2025: What It Means for Job Boards and Recruiters
 Happy Friday, Job Board Doctor friends.
This week I intended to write about Indeed Connect overview this week as a follow up to last week’s Indeed financial reporting update.
However, with the U.S. Government shut down ending and the announcement from the Department of Labor that we are unlikely to get either September or October labor market updates, I asked the Aspen Tech team to give us a Quarter 3 U.S. labor market review this week.
Lots of good intel here- the Google for Jobs and remote work data caught my eye. Tell me what caught yours.
Indeed Connect will come next week, promises.
Labor Market Overview
The U.S. labor market showed signs of equilibrium in the third quarter of 2025. Total job vacancies were essentially unchanged, edging down 0.1% from 6.23 million in July to 6.22 million in October (Figure 1). Compared with one year earlier, postings were 4.2% lower, confirming a gradual easing in demand after two years of post-pandemic acceleration.
Despite softer totals, activity remained high. Employers generated 14.4 million active postings across 131,000 organizations, averaging 670,000 new vacancies each week. The scale and diversity of openings spanning more than 18,000 cities and 3,000 job titles underscore the resilience of U.S. hiring demand.
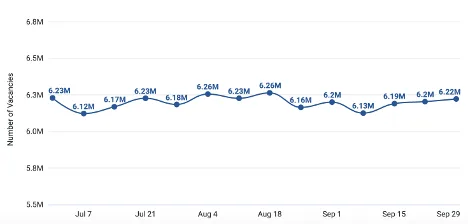
Figure 1: U.S. job vacancy trend, weekly totals, Q3 2025
Regional Divergence: Midwest Expansion, Coastal Slowdown
Labor market performance varied sharply across states. Iowa (+4.1%), South Dakota (+4.0%), and Wyoming (+3.1%) led Q3 growth, while New Mexico (-8.7%) and Rhode Island (-7.2%) posted the steepest declines. Metro-level analysis points to similar contrasts, with Des Moines (+7%), Baton Rouge, and Columbus among the best-performing mid-sized cities (Figure 2).
For job boards, these differences translate into opportunity. Growth in smaller Midwestern metros suggests rising regional investment in hiring, while coastal slowdowns highlight markets where employers may consolidate recruitment spend. Boards can use this intelligence to direct advertising efforts, strengthen relationships with regional employers, and refine promotional campaigns around local recovery themes. See detailed state-level vacancy trends in the full Q3 2025 U.S. Jobs Report.
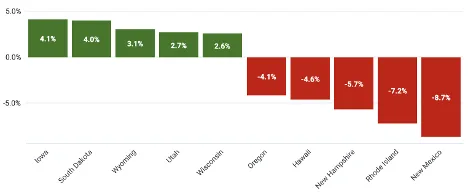
Figure 2: Change in Vacancy by State, Q3 2025
Sector Trends: Real Estate and Engineering Lead Recovery
Hiring momentum shifted toward technical and operational roles in Q3. Of 37 tracked job categories, 24 expanded while 13 contracted. The strongest increases occurred in Real Estate (+20%), Animal Care (+9%), and Engineering (+8%), signaling renewed investment in property, logistics, and infrastructure projects.
By contrast, Education (-19%), Creative (-8%), and Science (-7%) registered the sharpest declines, consistent with seasonal adjustments and tighter public-sector budgets.
Remote Work: Stable but Specialized
Remote vacancies rose 1.3% quarter-over-quarter to 231,918 active listings. YoY, they declined 3.3%, less than the broader market’s 4.2% fall, showing steady employer demand for distributed talent.
Information Technology (16.1%), Business Services (12.0%), and Retail (7.1%) remain the largest sources of remote jobs. For job boards, these categories continue to deliver strong candidate engagement. Enhanced tagging and filter precision can help match remote or hybrid job seekers more efficiently, improving site performance metrics and employer ROI.
Salary Transparency Reaches a Tipping Point
More than half of all U.S. job listings now include pay ranges, marking a national inflection point. 50.7% of postings as of October 1 disclosed salary details, a 3.5% quarterly increase and a 17.9% YoY gain.
Legislative momentum is a key driver. YoY, Minnesota (+32 percentage points), Illinois (+31), and New Jersey (+30) recorded the largest increases in disclosure rates following the enactment of new transparency laws (Figure 3).
The median full-time advertised salary held steady at $62,400, with Washington, D.C. at the top ($92,508) and West Virginia lowest ($46,582).
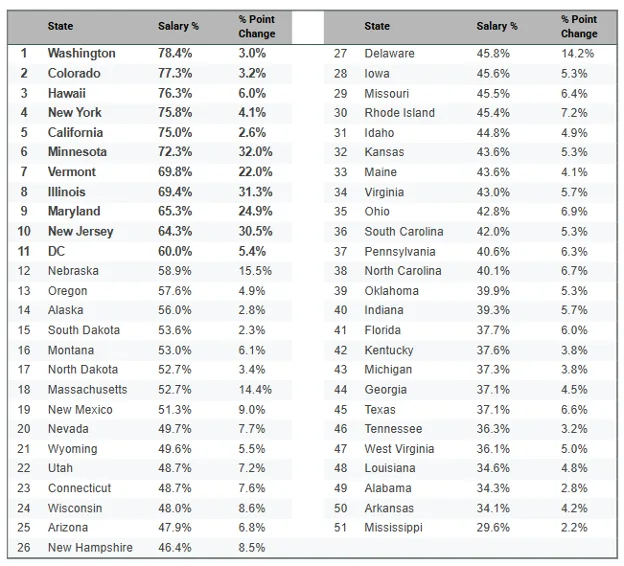
Figure 3: Salary Disclosure by State
Google for Jobs: The Evolving Visibility Landscape
Google for Jobs (GFJ) remains a critical channel for job discovery. In Q3 2025, applicant tracking systems (ATS) and direct employers accounted for 16.2% of all visible buttons on GFJ, ranking just behind Indeed’s share.
This shift reflects how search visibility is redistributing toward employers and ATS platforms that maintain structured, transparent postings. Workday led among ATS providers, while Compass Group, Robert Half, and The Capital Grille were among the top direct employers (Figure 4).
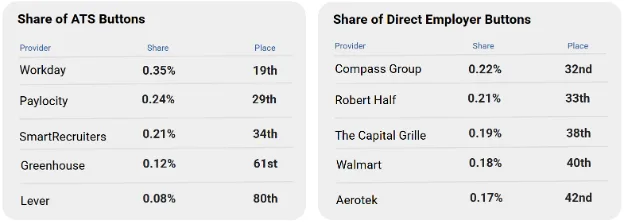
Figure 4: Share of ATS and Direct Employer Buttons, end of Q3 2025
For job boards, this trend highlights the competitive impact of data quality and schema optimization. Google’s ranking favors postings that are complete, current, and include pay information. Boards that consistently publish structured, transparent listings are better positioned to maintain visibility and traffic (Figure 5).
Figure 5: Change in the Share of Buttons for Top Providers in the US, Q3 2025
Sector Spotlight: Healthcare
Healthcare continues to dominate national hiring volumes but remains under pressure. Job postings in the sector were 4.5% lower YoY, reflecting reduced demand for administrative and non-clinical staff.
Nursing remains the largest component of healthcare hiring, with Licensed Practical Nurse (LPN/LVN) roles exceeding 36,000 active postings and a median pay range of $61,000–$71,000. Regional salary differentials remain significant: Oregon, Washington, and Massachusetts rank highest.
Applying Labor Market Data: Turning Insight into Action
Labor market data is most valuable when applied with precision to inform strategic decision-making across multiple functions.
- Marketing: Build Credibility Through Insight
Publishing regular, data-based updates enhances a job board’s authority. Highlighting state growth trends such as Iowa, South Dakota, and Wyoming, leading Q3 gains demonstrates expertise in regional hiring dynamics. Similarly, the rise in salary transparency past 50% provides a timely focal point for content that educates employers on compliance and market behavior. - Sales: Focus on Verified Growth Areas
Using vacancy and category data allows commercial teams to identify where hiring demand is expanding. Q3 growth in Real Estate and Engineering shows where recruitment budgets are active. Metro-level patterns, such as gains in Des Moines and Baton Rouge, help boards prioritize outreach to employers to increase headcount. - Leadership: Anticipate Regulatory and Competitive Shifts
State-level transparency laws are reshaping job content and search visibility. Boards operating in Minnesota, Illinois, and New Jersey can expect rising demand for automated salary-disclosure tools. At the same time, competition is evolving: ATS and direct employer listings now account for 16.2% of visibility on Google for Jobs. Strategic differentiation will depend on data depth, accuracy, and service quality. - Recruitment Strategy: Calibrate Pay and Supply
Salary benchmarks support data-led talent placement. The U.S. median salary of $62,400, paired with regional differentials from $92,508 in Washington, D.C. to $46,582 in West Virginia, helps recruiters guide clients toward realistic compensation levels. In sectors such as healthcare and technology, where demand remains high, these metrics enable better pricing and candidate targeting. - Product and Partnerships: Add Value Through Intelligence
Embedding real-time vacancy and wage data into dashboards or reports transforms listings into actionable insight. Boards can use this intelligence to help clients benchmark performance or track competitor activity. Partnering with chambers of commerce, staffing firms, or media outlets to publish regional hiring indices also builds brand authority and extends reach.
Conclusion
The third quarter of 2025 marks a period of balance rather than decline. Hiring volumes have steadied, pay disclosure has become standard practice, and remote work continues to shape the structure of employment.
For job boards and recruiters, the next advantage lies in interpretation. Understanding where demand is shifting, where regulation is tightening, and where candidates are concentrating will separate data users from data leaders.
Data Methodology
The findings in this analysis are based on Aspen Tech Labs’ JobMarketPulse platform, which monitors hiring activity from over 131,000 direct employer career sites in the U.S. This dataset captures a significant share of total U.S. job postings, providing high-quality, near real-time insight into employer demand. Figures presented in this report reflect postings collected directly from employers and may not represent the entire labor market, but they offer a dependable indicator of hiring trends across industries and regions.
Aspen Tech Labs’ JobMarketPulse provides the intelligence to make that distinction, turning raw market activity into actionable insight that supports smarter marketing, sales, and recruitment decisions.
Ask us about a demo of Hiring Signals to optimize your sales efforts.
[Want to get Job Board Doctor posts via email? Subscribe here.]
[Got a tip, document or intel you want to share with the Doc? Tell me.]
Comments (0)