
Q2 2026: The Quarter Job Postings Got Their Groove Back

The official data this quarter sent a mixed signal. June’s nonfarm payrolls report came in soft at just 57,000, well below the roughly 115,000 consensus. But that followed a stronger-than-expected May, and JOLTS data showed May job openings climbing to 7.6 million, the highest level in two years, with the highest ratio of openings to unemployed workers since January 2025.
Job Postings Snapped Their Losing Streak
The postings data backs that up. Aspen Tech Labs’ JobMarketPulse figures, sourced directly from employer career sites rather than survey extrapolations, show hiring demand accelerating through Q2, reinforcing that May and JOLTS were the more telling signal than June’s soft print.
U.S. job postings closed Q2 2026 at 6.45 million, up 3.7% YoY. Every single month of the quarter held above 6.4 million, a level the market hadn’t touched at any point in the prior twelve months, with April’s 6.48 million marking the high point of the trailing year since the decline in December 2025.

Talroo brings clarity to improve new-hire retention
You filled the seat, but not with someone who plans to stay. The candidate made it through your entire interview process while quietly interviewing with other companies that pay 25% more.
When expectations aren't clear up front, retention suffers.
Get clarity up front with Talroo's SmartQualify.
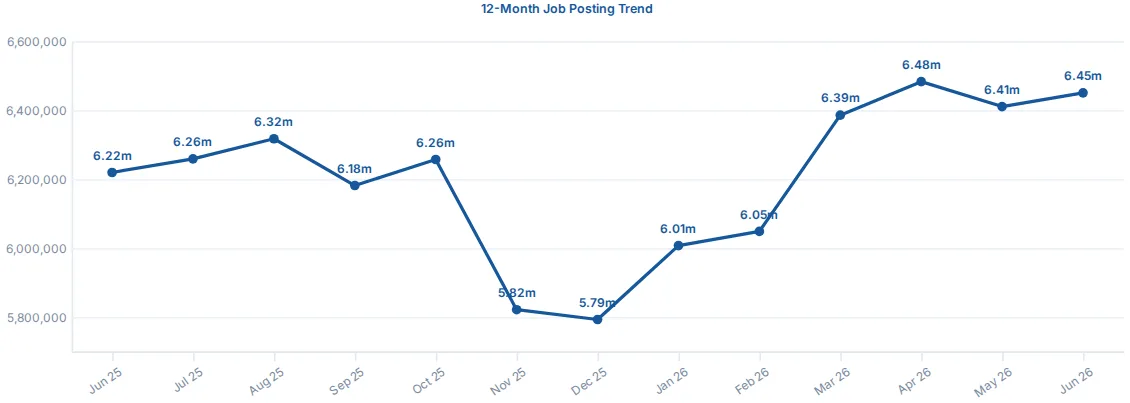
Figure 1: U.S Job Posting Trend, past 12 Months
More importantly: every month of Q2 beat its 2025 counterpart, a clean reversal from the year-over-year declines that defined most of last year’s reports. June logged the strongest gain at +3.7%, up from a more modest +1.0% in March, so this isn’t just a weak-2025-baseline illusion. Demand genuinely held up through the spring hiring season.
Meanwhile, JOLTS data (which lags a full cycle behind postings) showed May job openings at 7.6 million, up 3.9% YoY and the highest since May 2024, with 1.04 openings per unemployed worker, also the highest ratio since January 2025.
Growth Reached Most of the Map, Just Not Evenly
Most states posted more job listings than a year ago. Washington, DC led the pack at +11.5%, followed by Wisconsin (+7.4%) and Idaho (+6.7%). On the other side, New Mexico (-3.9%), New Jersey (-2.6%), Maine (-0.9%), and North Dakota (-0.8%) were the only real laggards.
Metro-level data tells the sharper version of that story. Dallas led the top 10 largest metros at +9.4% YoY, with New York, Chicago, Boston, and DC all returning to positive territory after several soft quarters. But the real fireworks were in tech-adjacent metros:
- San Jose: +15.4% YoY, powered by stepped-up hiring from Apple, Nvidia, Google, and Applied Materials
- Madison, WI: +11.4%
- Raleigh-Cary, NC: +11.0%, life sciences and tech
- Greenville-Anderson-Greer, SC: +10.0%
On the losing end, Sacramento posted the sharpest metro decline at -9.1%, with broad softness across retail, healthcare, and education, followed by Albuquerque and Birmingham, both down 4.3%.
White Collar Led, Blue Collar Held, Healthcare Kept Pace
Break the recovery down by segment and a clear hierarchy emerges. White-collar roles grew fastest at +6.3% YoY, driven by IT, business services, and engineering. Blue-collar demand grew 2.7%, supported by warehouse, transportation, and production hiring. Healthcare expanded 2.8%, though nursing specifically grew only modestly while broader healthcare postings accelerated faster.
By category, Engineering (+20.7%) and Information Technology (+15.1%) posted the strongest growth of anything we track, with Warehouse (+13.6%), Production (+11.4%), Business Services (+10.4%), and Transportation (+8.9%) close behind. Restaurants remained the single largest category by volume at 782,000+ postings, but kept shrinking, down 2.3% YoY. Education slipped 3.0% YoY as well.
Recruiting agency postings tell an interesting side story here: agency volume overall rose 2.7% YoY, and nursing and healthcare agency postings jumped 9.8% and 11.1% respectively, but agency IT staffing actually fell 2.1% YoY even as direct-employer IT postings surged 15.1%. Translation: this quarter’s tech hiring rebound is being driven by companies hiring directly, not by staffing firms.
AI Hiring Is Reshaping the Category Map, Not Just the Tech Sector
We layered this quarter’s data against the World Economic Forum’s Future (WEF) of Jobs 2030 framework, which sorts occupations into three buckets: high automation risk, “transforming but still human,” and AI-driven growth. The pattern already shows up in the postings.
Roles the WEF flags as growing because of AI infrastructure buildout are posting the biggest gains: AI Specialist postings are up a staggering 94.8% YoY, with Data Analyst (+19.8%), DevOps (+13.9%), and Project Manager (+13.4%) all climbing. Meanwhile, roles the WEF flags as automation-exposed, like Data Entry Clerk, are still growing in raw postings (+10.0%), a reminder that “at risk of automation” and “declining today” aren’t the same thing yet.
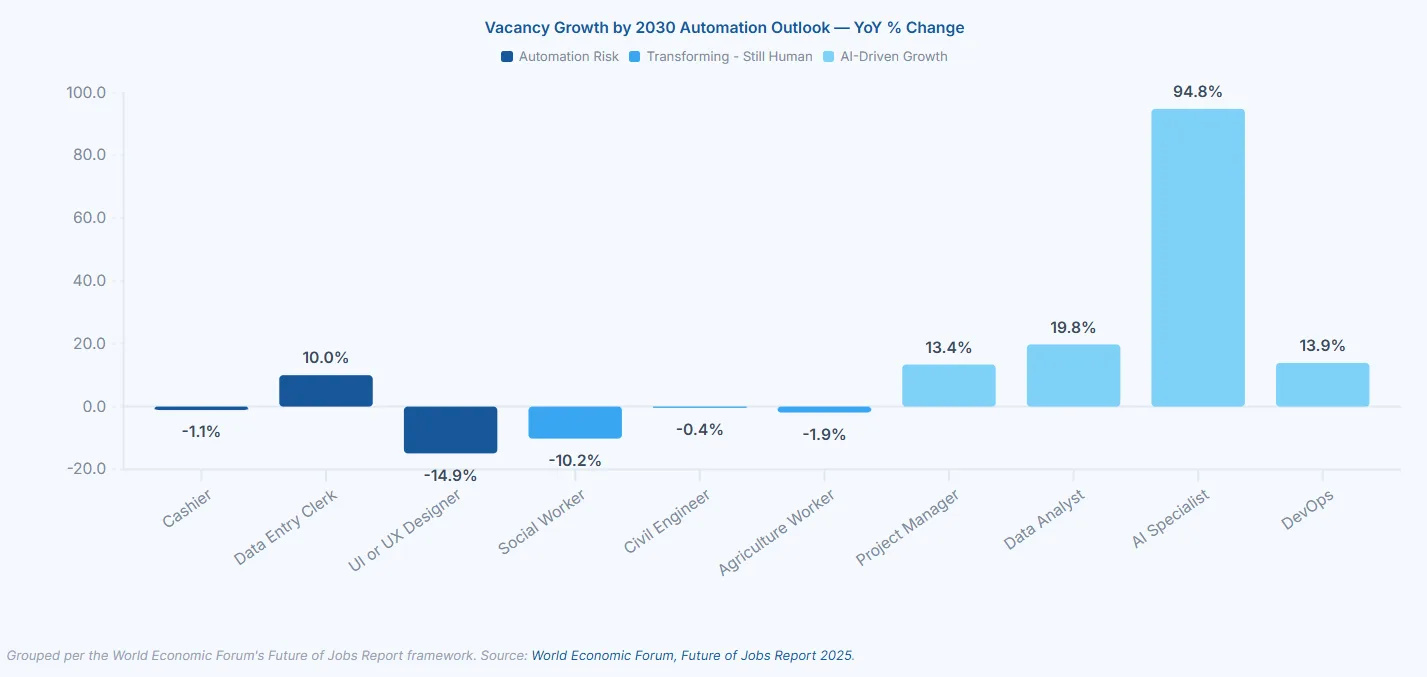
Figure 2: Vacancy Growth by 2030 Automation Outlook
Remote Work: Stable, Not Surging
Remote roles held at 3.4% of all active postings in June, essentially flat YoY, with total remote vacancies at 216,221, up 3.3% YoY but down 14.2% from March’s seasonal peak. Information Technology remains the most remote-friendly category (14.1% of IT postings), followed by Marketing (12.3%) and Business Services (10.5%). The story here hasn’t changed: remote work has found its ceiling and is holding there.
Salary Transparency Keeps Climbing
53.6% of U.S. job postings now disclose a pay range, up 5.0 percentage points (a 10.3% relative increase) YoY, with disclosure climbing in nearly every month since June 2025.
 Figure 3: States With vs. Without Pay Transparency Laws, last 12 months
On average, states with pay-transparency laws disclose salary in 81.2% of postings, compared to 42.7% in states without one, a roughly 39-point gap that’s held steady all year. Individual states still vary widely within each group, but the divide between “have a law” and “don’t” remains the single biggest predictor of disclosure. Massachusetts was this quarter’s biggest mover, up 31.9 percentage points after its new disclosure law took effect.
On pay itself, the median advertised full-time salary hit $62,234, up 6.1% YoY (+$3,578), comfortably outpacing headline inflation. Median hourly pay reached $18.38, up 2.4%.
But the gains weren’t evenly spread: Cooks (+5.7%), Electricians (+4.9%), and Registered Nurses (+3.6%) led the way, while Software Developers (-2.1%) and Physicians (-3.2%) actually saw advertised pay contract, continuing a trend of soft compensation growth at the high end of white-collar and healthcare work.
DC remains the highest-paying market by a wide margin at $100,942 median full-time salary, while West Virginia, Kentucky, and Louisiana all sit below $47,500, a gap that’s stayed structurally stable rather than closing.
Worth Watching: Who Owns Job Search Next
Google for Jobs is still the dominant discovery surface for job seekers, holding an average position of 1.06 in search results; AI overviews haven’t meaningfully dented that yet. But there was a real changing-of-the-guard moment buried in the referral data: LinkedIn overtook Indeed for the first time in this dataset’s history, at 20.0% vs. 19.0% of Google for Jobs referral share in June.
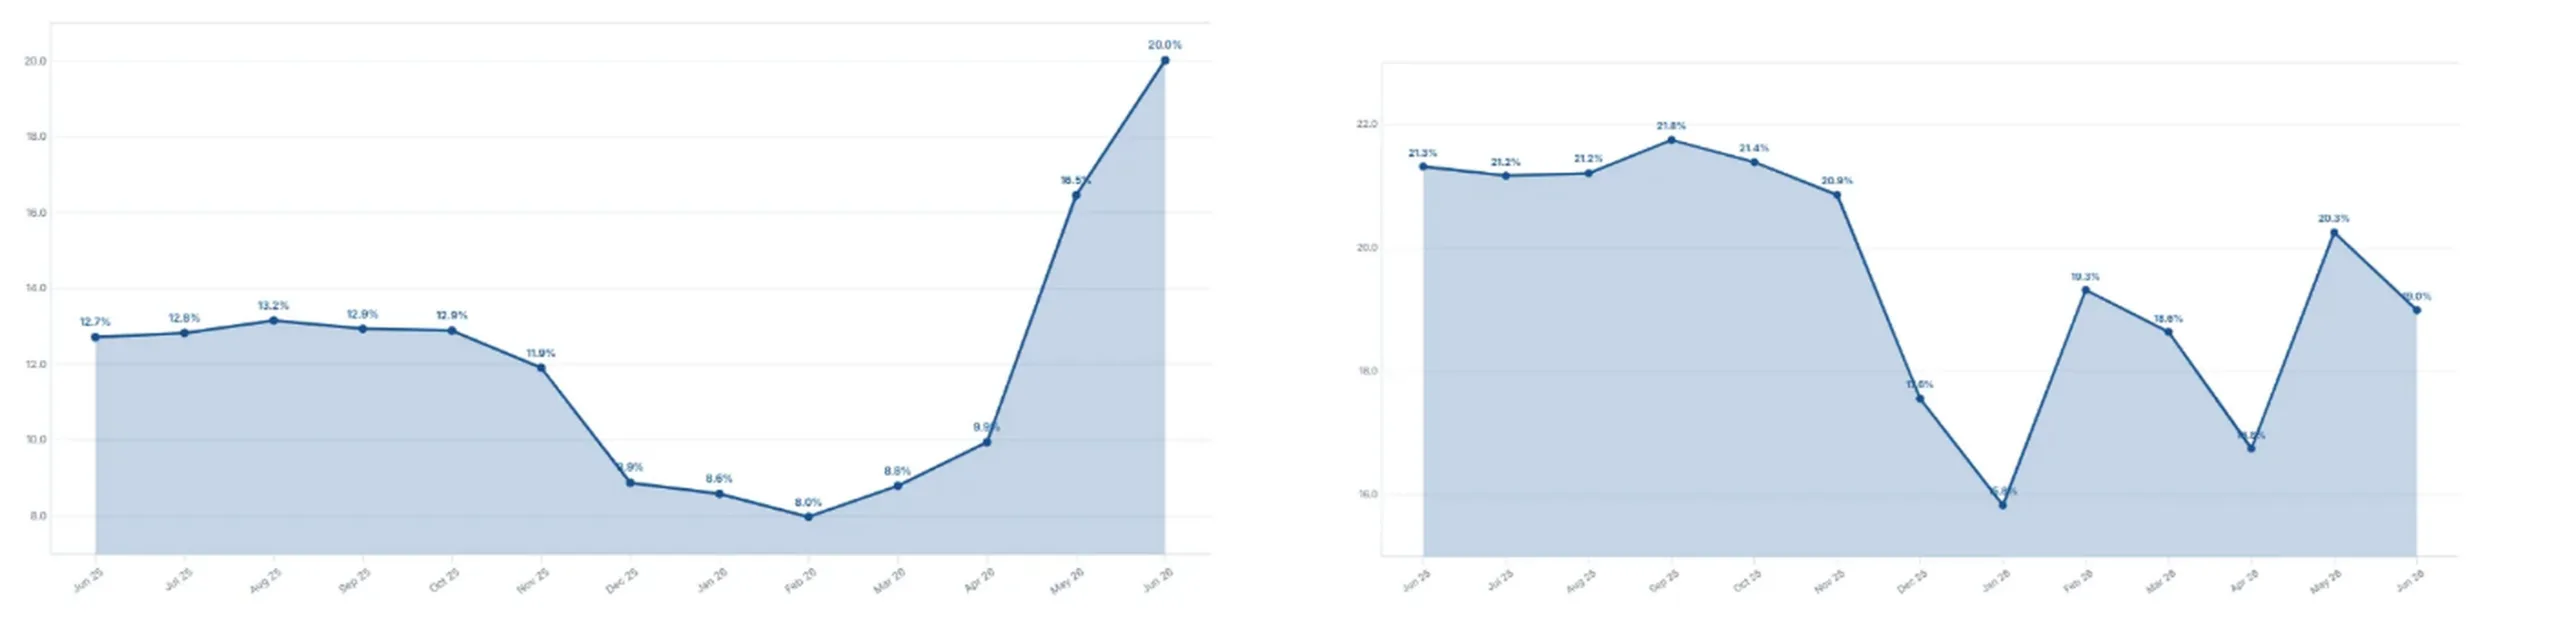
(Left) Figure 4: Google for Jobs Referral Share, Indeed (Jun 2025–Jun 2026) (Right) Figure 5: Google for Jobs Referral Share, LinkedIn (Jun 2025–Jun 2026)
The bigger question is: will AI platforms stay a passive discovery layer, or start building their own job-advertising products entirely? ChatGPT, Gemini, and Claude are increasingly becoming a starting point for job searches, summarizing roles, comparing options, and surfacing listings via web searches. Right now, that traffic is largely invisible to distribution analytics. That won’t last.
The Bottom Line
U.S. hiring demand moved back into positive territory in Q2 2026, with postings up 3.7% YoY and every single month of the quarter outpacing 2025. It’s a genuine recovery, but a selective one. Tech-adjacent metros and white-collar categories led the charge, healthcare grew more slowly than the market overall, and agency staffing lagged the direct-employer rebound, especially in IT. Pay is climbing faster than inflation, but mostly in trades and frontline roles rather than across the board, and transparency continues its steady march toward becoming table stakes everywhere.
Employers are hiring with more precision than they were a year ago. Watch the categories and metros leading as reported above for the 2nd quarter; they’re the best bet for where momentum carries into the second half of 2026.
Data Methodology
The findings in this analysis are based on Aspen Tech Labs‘ JobMarketPulse platform, which as of July 1, 2026, collects job posting data from more than 300,000 companies worldwide, including over 225,000 in the United States. Job postings are sourced exclusively from direct employer career websites and updated daily; recruitment agency postings are excluded from all trends unless otherwise noted. Salary data reflects advertised compensation extracted directly from job listings and may not represent final offers; figures are normalized across hourly, weekly, monthly, and annual pay rates. Job counts represent unique active postings per month, deduplicated and refreshed regularly, and the analysis excludes employer additions or removals resulting solely from improvements to Aspen’s data coverage. Changes reflect real shifts in hiring activity rather than database expansion or methodological updates. Government employment figures are sourced from the U.S. Bureau of Labor Statistics.
Vendors: Are you experiencing an uptick in postings?
TA: Are the coffers opening up in your company to start hiring again?
I will be back next week with an update from Maki People and a lot more.
Until Next Time,
Julie “The Doc” Sowash
[Want to get Job Board Doctor posts via email? Subscribe here.]

Comments (0)