
The Jobs Report You Won’t Get From the BLS
 Happy Friday Job Board Doctor friends. As we wrap up April, it is always a good time for our monthly check-in on how what we are seeing in job posting data.
No reason to delay – let’s dive in!
BLS Revisions
March payrolls came in at +178,000, well above the consensus forecast of 59,000. On paper, that looks like a strong jobs report.
But the BLS has now revised 10 of its last 11 monthly reports, nearly all downward.
December’s headline of +50,000 was restated to -17,000 just two months later. The jobs numbers you see today are rarely the numbers that sticks. Fortunately, real-time job posting data doesn’t get revised.
Here is what it shows for Q1 2026.
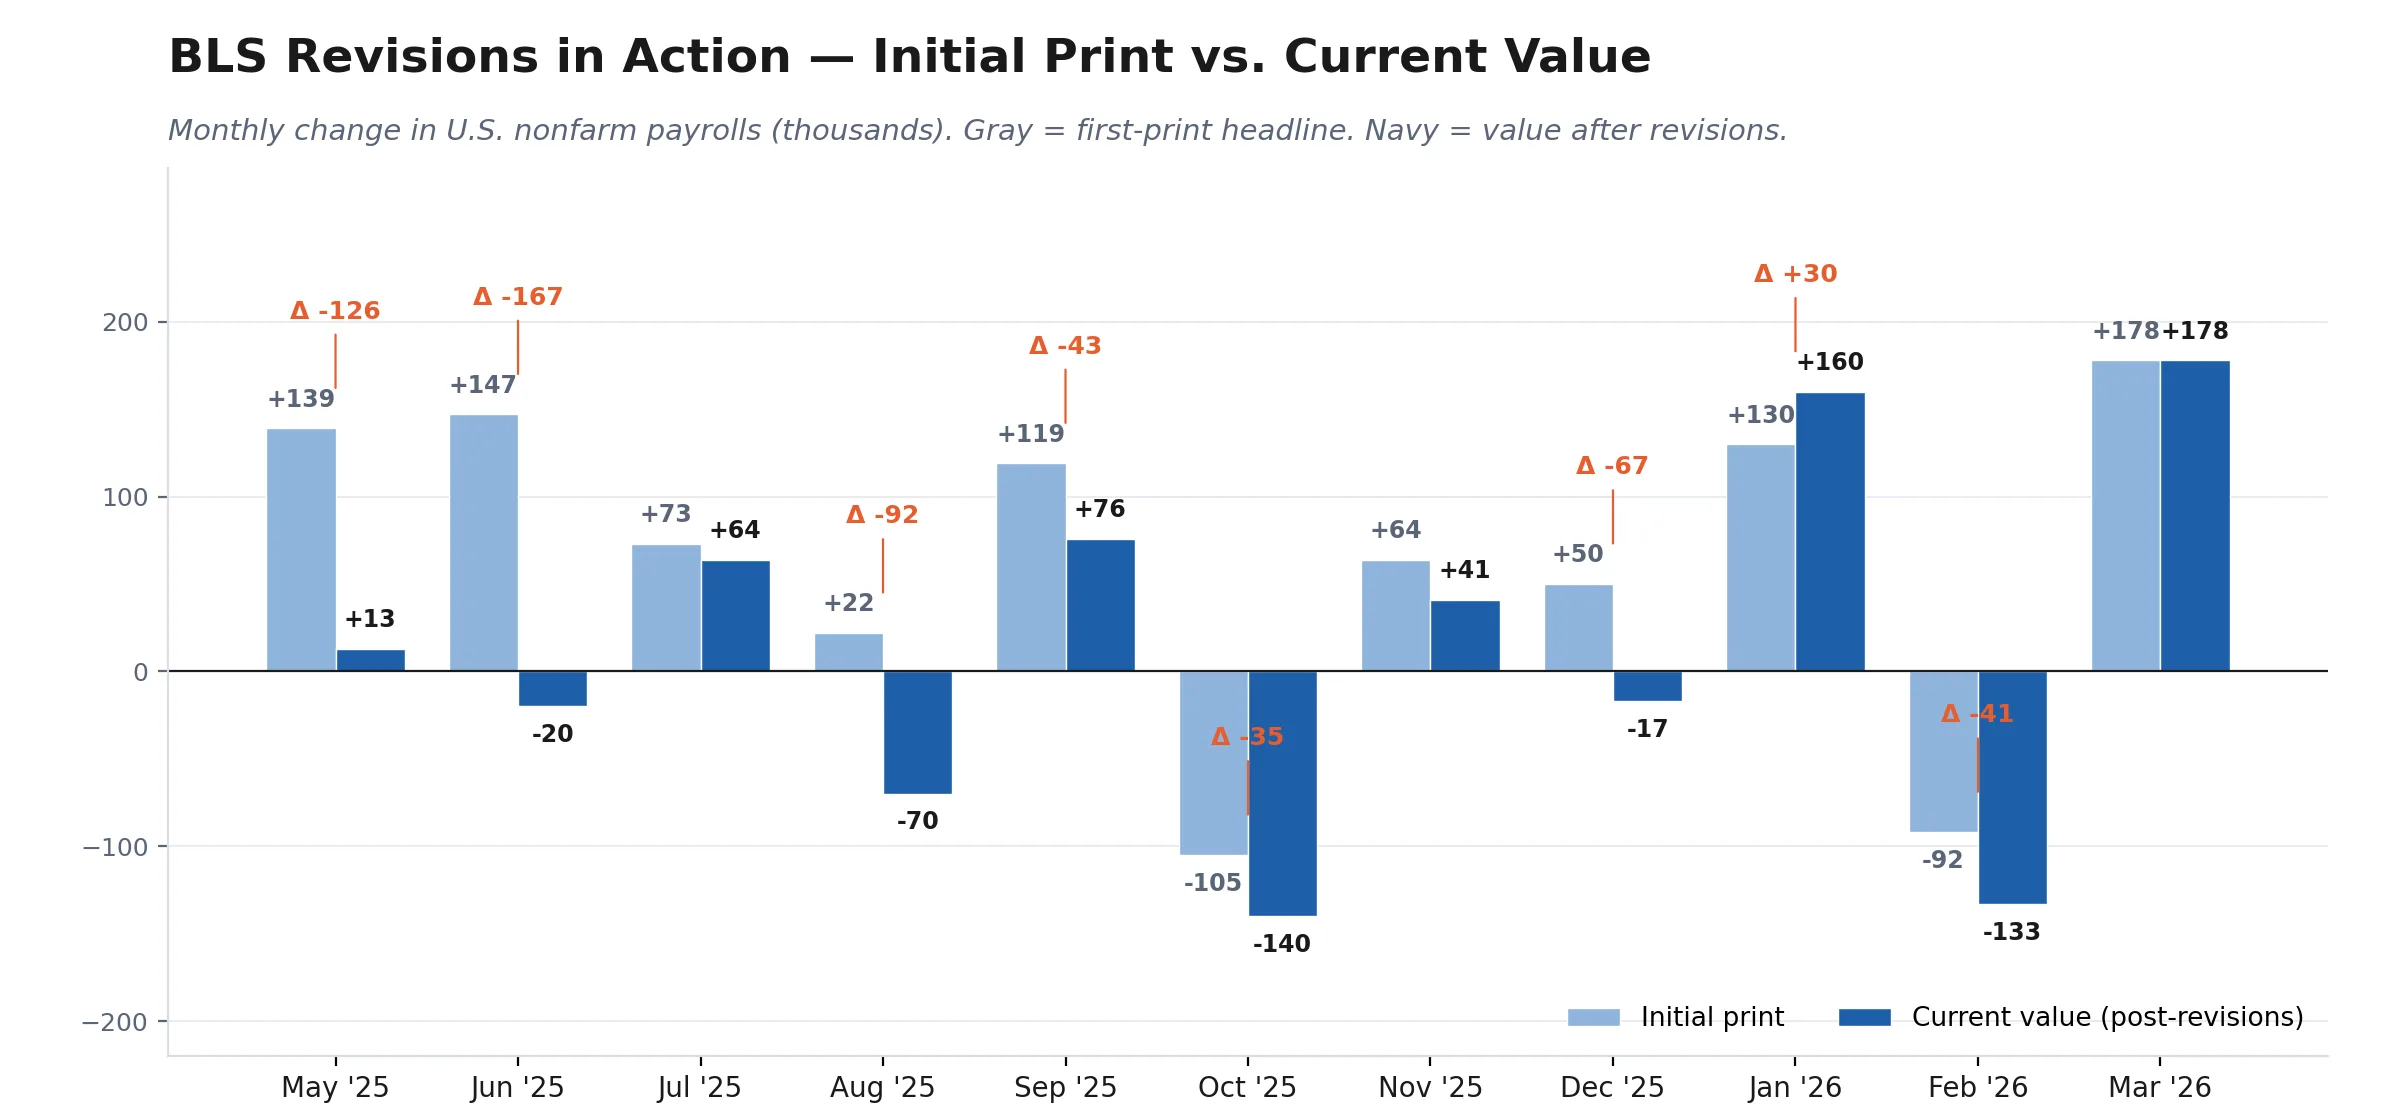
Figure 1: Monthly Change in U.S. Nonfarm Payrolls
Source: U.S. Bureau of Labor Statistics, Employment Situation and FRED PAYEMS series.
The Overall Number Doesn’t Tell You Much
Aspen’s JobMarketPulse data shows U.S. job postings are down 2.0% year-over-year through Q1.
But the fuller picture is: 44 states down, wages up for full-time workers, and remote postings rebounding faster than the overall market. Not exactly the collapse many were bracing for.
Postings rebounded 9.4% from December to March, a seasonal pattern consistent with Q1 2025, and total active vacancies sat at 6.27 million by end of quarter.
The data makes one thing clear: there is no single jobs market right now. Where you sit; by role, by sector, by region, determines almost everything.
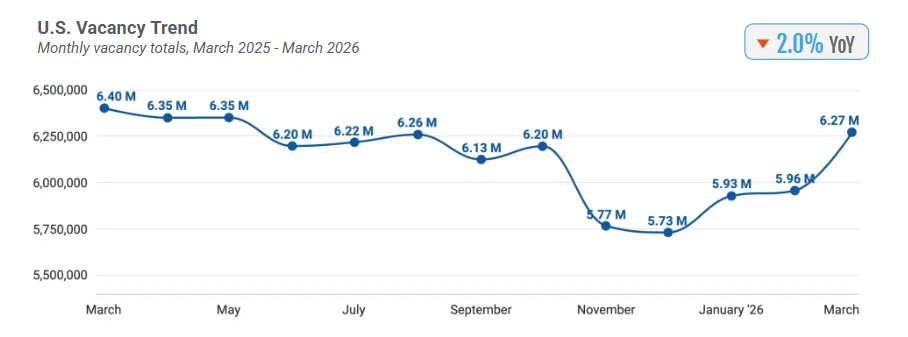
Figure 2: U.S. Vacancy Trend – last 12 months
Some Sectors Are Up. Others Aren’t.
Engineering postings grew 8.0% year-over-year. AI Specialist roles jumped 76.9%. Trades and Infrastructure – warehousing, construction, and skilled trades expanded 2.5%. Electricians saw advertised wages climb 8.7%, the largest gain among job titles tracked. At the same time, Marketing fell 6.4%. Nursing dropped 5.6%. Administrative Support is down 5.7%. Certified Nurse Assistants, a role that held up well through previous downturns, declined 9.2% year-over-year. Roles tied to physical infrastructure and technical work are holding or growing. Roles tied to organizational support and certain clinical functions are getting cut back. That pattern has real consequences for how companies should be thinking about hiring plans and compensation benchmarks right now.

Figure 3: Job Categories with the Largest YoY Gains and Declines
Geography: Mostly Down, With Some Bright Spots
44 out of 51 states posted year-over-year declines. Rhode Island (-11.9%), Oregon (-10.4%),and Maryland (-8.3%) saw the sharpest drops. The states that grew did so modestly; Wisconsin led at just +2.9%.
But zoom into the metro level, and a different picture emerges.
Dallas posted positive year-over- year growth among major markets. Dayton, Reno, and Huntsville, none of which are traditional hiring hubs, are among the fastest-growing metro areas in the country by job-posting volume.
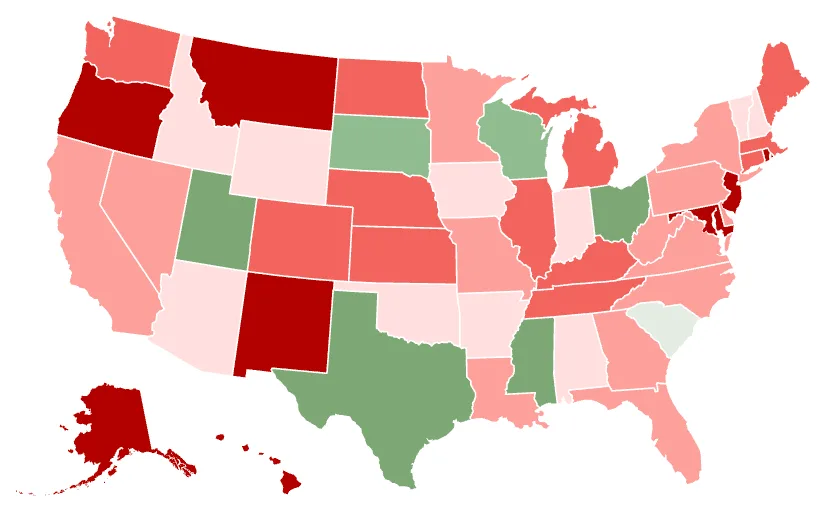
Figure 4: U.S. Change in Job Vacancies by State – last 12 months
Wages Are Up Depending on Who You Are
Median full-time advertised salaries reached $64,147 in March, up 4.3% year-over-year and ahead of headline inflation at 3.3%. For full-time workers in the right roles, that’s a genuine gain. Electricians are up 8.7%. Software Developers and Project Managers each saw 4.7% increases. But hourly wages rose just 1.4%, well below inflation. Physician salaries declined 1.9%. Customer Service Representatives saw advertised pay drop 3.9%. There is also a notable milestone in the compensation data: more than half of U.S. job postings now include salary information, a threshold crossed for the first time in early 2025. Q1 2026 saw the first modest pullback in that trend. And the gap between states with pay transparency laws and those without remains significant: 78% versus 45%.
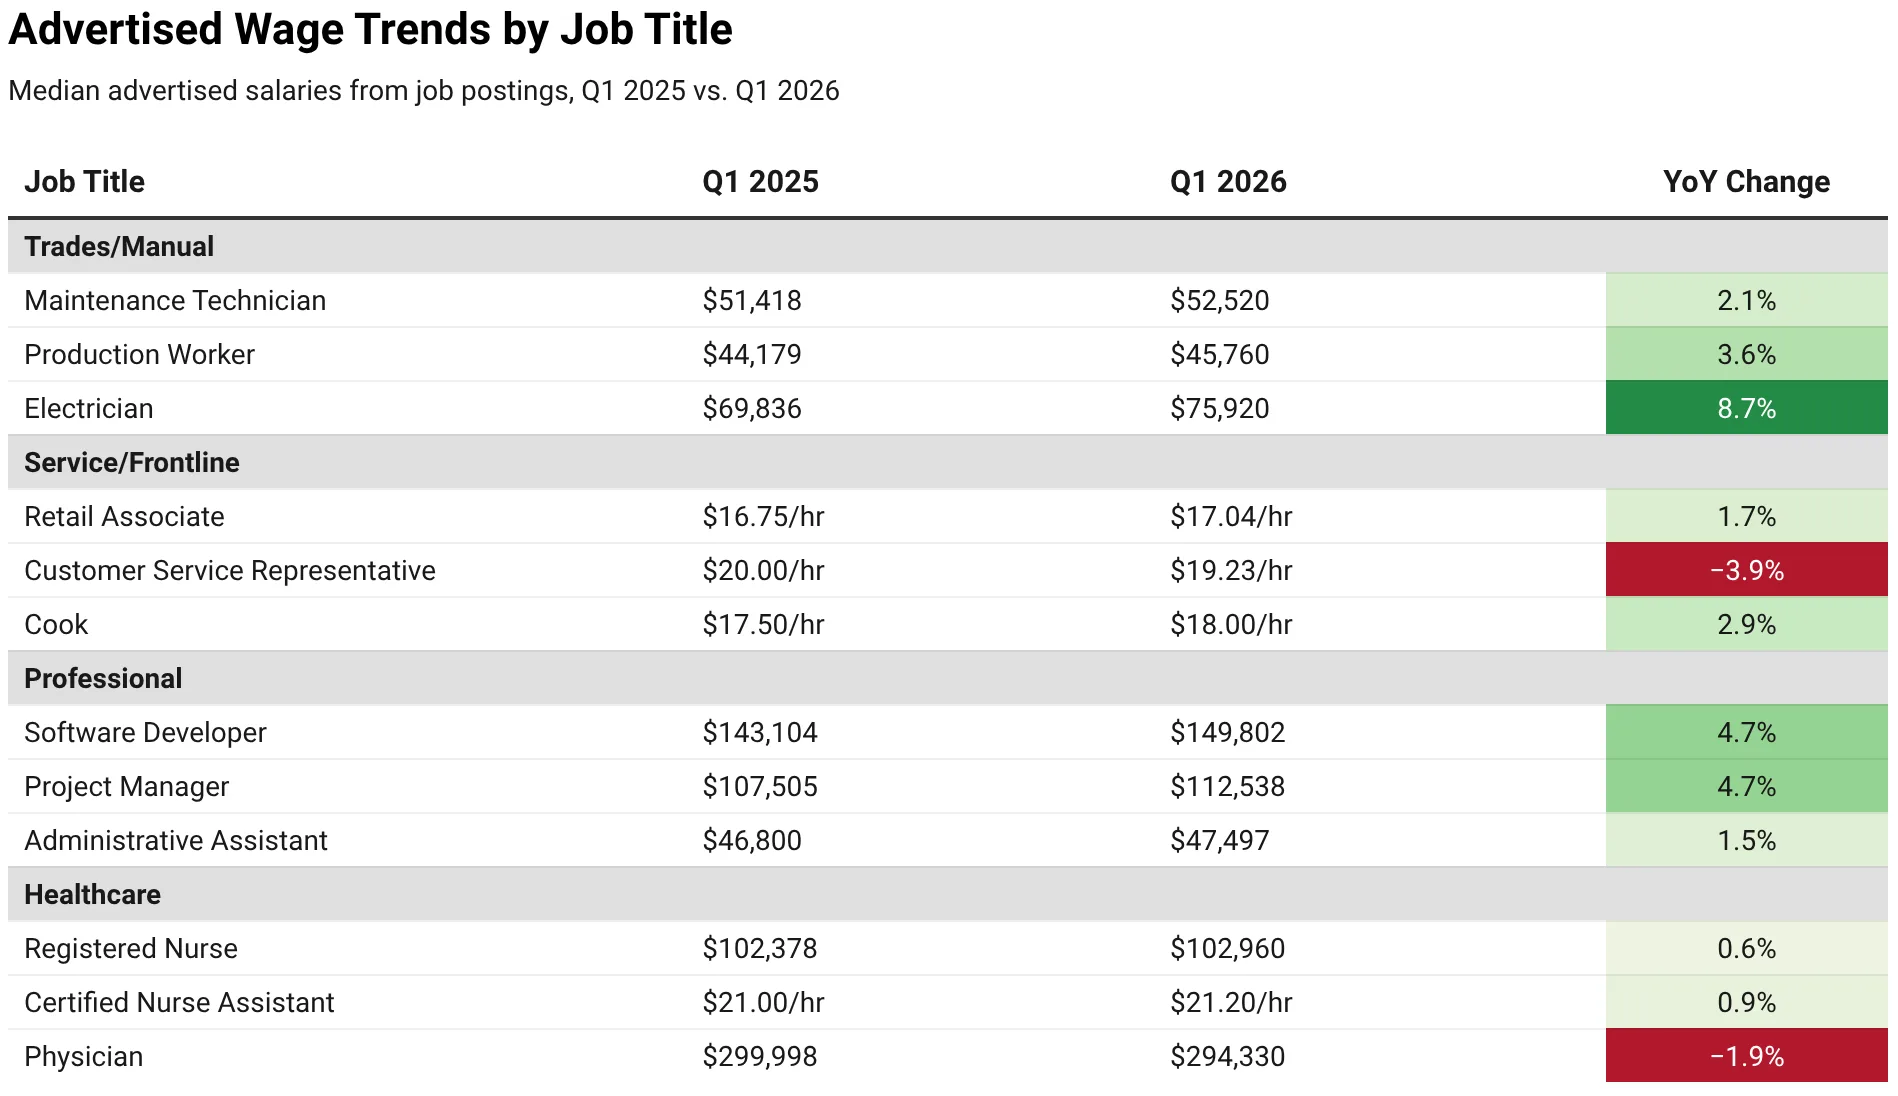
Figure 5: Advertised Wage Trends by Job Title
Remote Work Is Uneven, But Growing
Remote roles are 2.43% of all active vacancies in March, up from 2.12% a year ago. Remote postings grew 12.3% year-over-year and rebounded 22.6% quarter-over-quarter faster than the broader market. The composition shifted, too. IT now leads all categories by share of remote postings, followed by Marketing and Legal. Human Resources, which held the top spot last year, has dropped to ninth place. That tells you something about which functions employers are willing to keep flexible and which ones they are pulling back into the office.
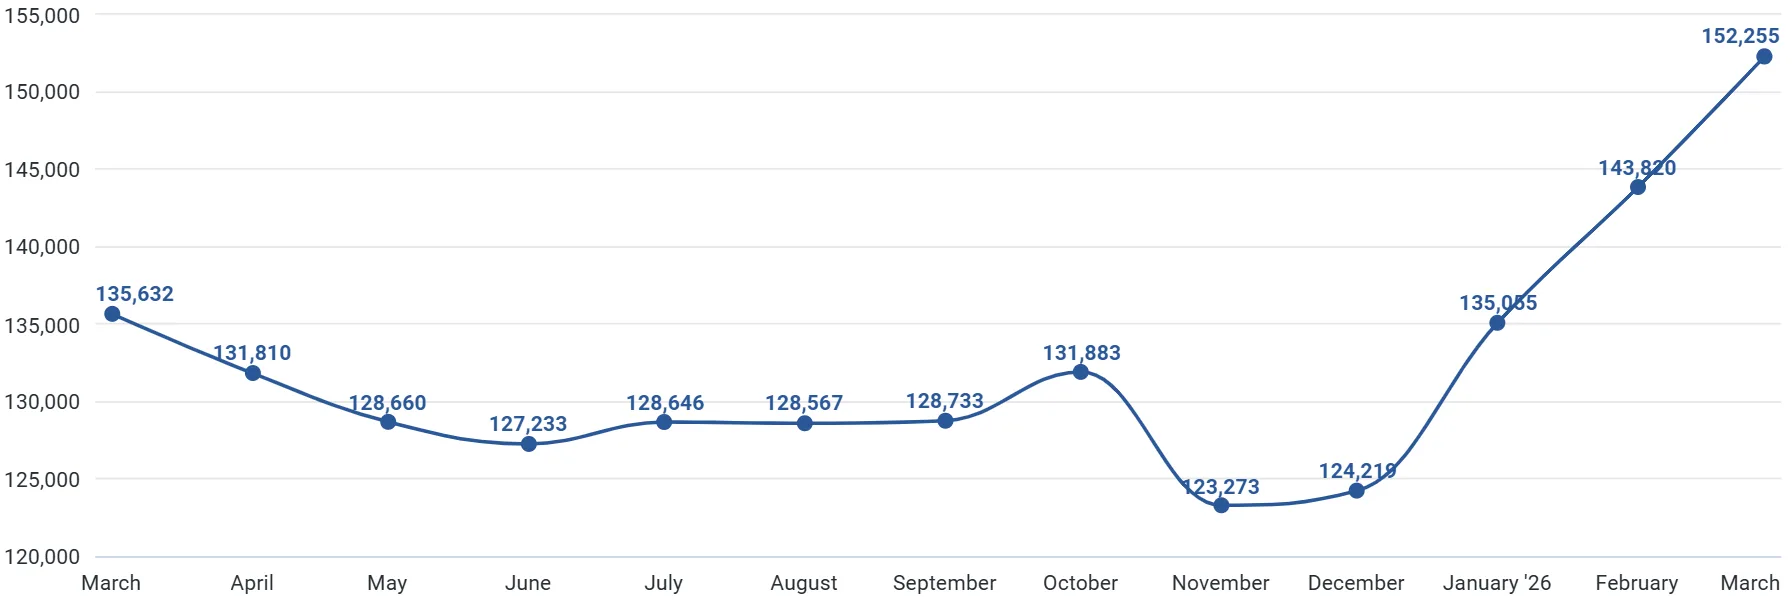
Figure 6: U.S. Remote Vacancy Trend – last 12 months
There’s More in the Full Report
The Q1 2026 JobMarketPulse U.S. Jobs Report goes further, breaking down vacancy trends bydirect employers versus recruitment agencies, mapping the fastest-growing and declining metros across the top 100 markets, and detailing which benefits are showing up most in job postings and what that tells us about how employers are competing for candidates right now. If you make decisions that depend on knowing where hiring is actually headed, it’s worth the read.
Download the Q1 2026 U.S. Jobs Report
What do you think? Tell me.
Until Next Time,
Julie “The Doc” Sowash
[Want to get Job Board Doctor posts via email? Subscribe here.]
[Got a tip, document or intel you want to share with the Doc? Tell me. Tip so hot you need it to be encrypted? Use Signal.]
Data Methodology
The findings in this analysis are based on Aspen Tech Labs’ JobMarketPulse platform, which monitors hiring activity from more than 300,000 direct employer career sites worldwide. This dataset captures a substantial share of live postings and provides near-real-time insight into
employer demand. All figures reflect information published directly by employers, including salary ranges where available. All data comes from posted job requirements; salary figures should be interpreted as indicators of market trends rather than confirmed offer amounts. Changes reflect real shifts in hiring activity rather than database expansion or methodological
Comments (0)