
S&P 500 Hiring Trends at the End of 2025: What Job Posting Data Reveals About Winners and Losers
 Happy Friday, Job Board Doctor friends! This week, we dive into S&P 500 hiring trends with our data analysis from Aspen Tech Labs. Enjoy!
Every December, job boards ask the same question from a different angle:
Are employers still hiring, or just holding on?
In 2025, the answer depends entirely on who you’re watching.
Some of the S&P 500’s biggest winners expanded hiring steadily as their businesses scaled, as AI infrastructure stocks drove some of the market’s strongest gains in 2025. Others posted historic stock gains while quietly pulling back on headcount. And among the year’s worst performers, hiring data shows where retrenchment is still underway and where stabilization may finally be starting.
Looking at daily job postings through JobMarketPulse, the divide is clear. Hiring did not move with the index. It followed business models, balance sheets, and exposure to long-cycle demand.
Year-in-Review: What the Hiring Data Shows
Across this group, 2025 was less about broad-based expansion and more about reset and divergence. Several companies entered the year with elevated hiring, cut sharply through the first half, and only partially rebuilt by year-end. Others delivered outsized stock gains while holding headcount flat or lower, signaling growth driven by pricing power, utilization, or efficiency rather than workforce expansion. A smaller subset showed genuine hiring recovery in the second half of the year, ending 2025 near or above midyear lows. Taken together, the data point to a year defined by recalibration rather than acceleration, with hiring outcomes increasingly decoupled from share price performance.
Where Stock Gains Were Backed by Hiring
The cleanest alignment between market performance and hiring came from companies tied to AI infrastructure and data storage, where AI-driven demand has lifted storage and memory manufacturers.
SanDisk stands at the extreme end of that spectrum. After relisting in February following its split from Western Digital, the SanDisk stock price finished the year up more than 800% YoY. Hiring activity rose alongside it. By year-end, SanDisk listed 289 live roles, more than 10% above its 90-day average. The increase was gradual, not episodic, pointing to sustained expansion rather than a post-listening surge.
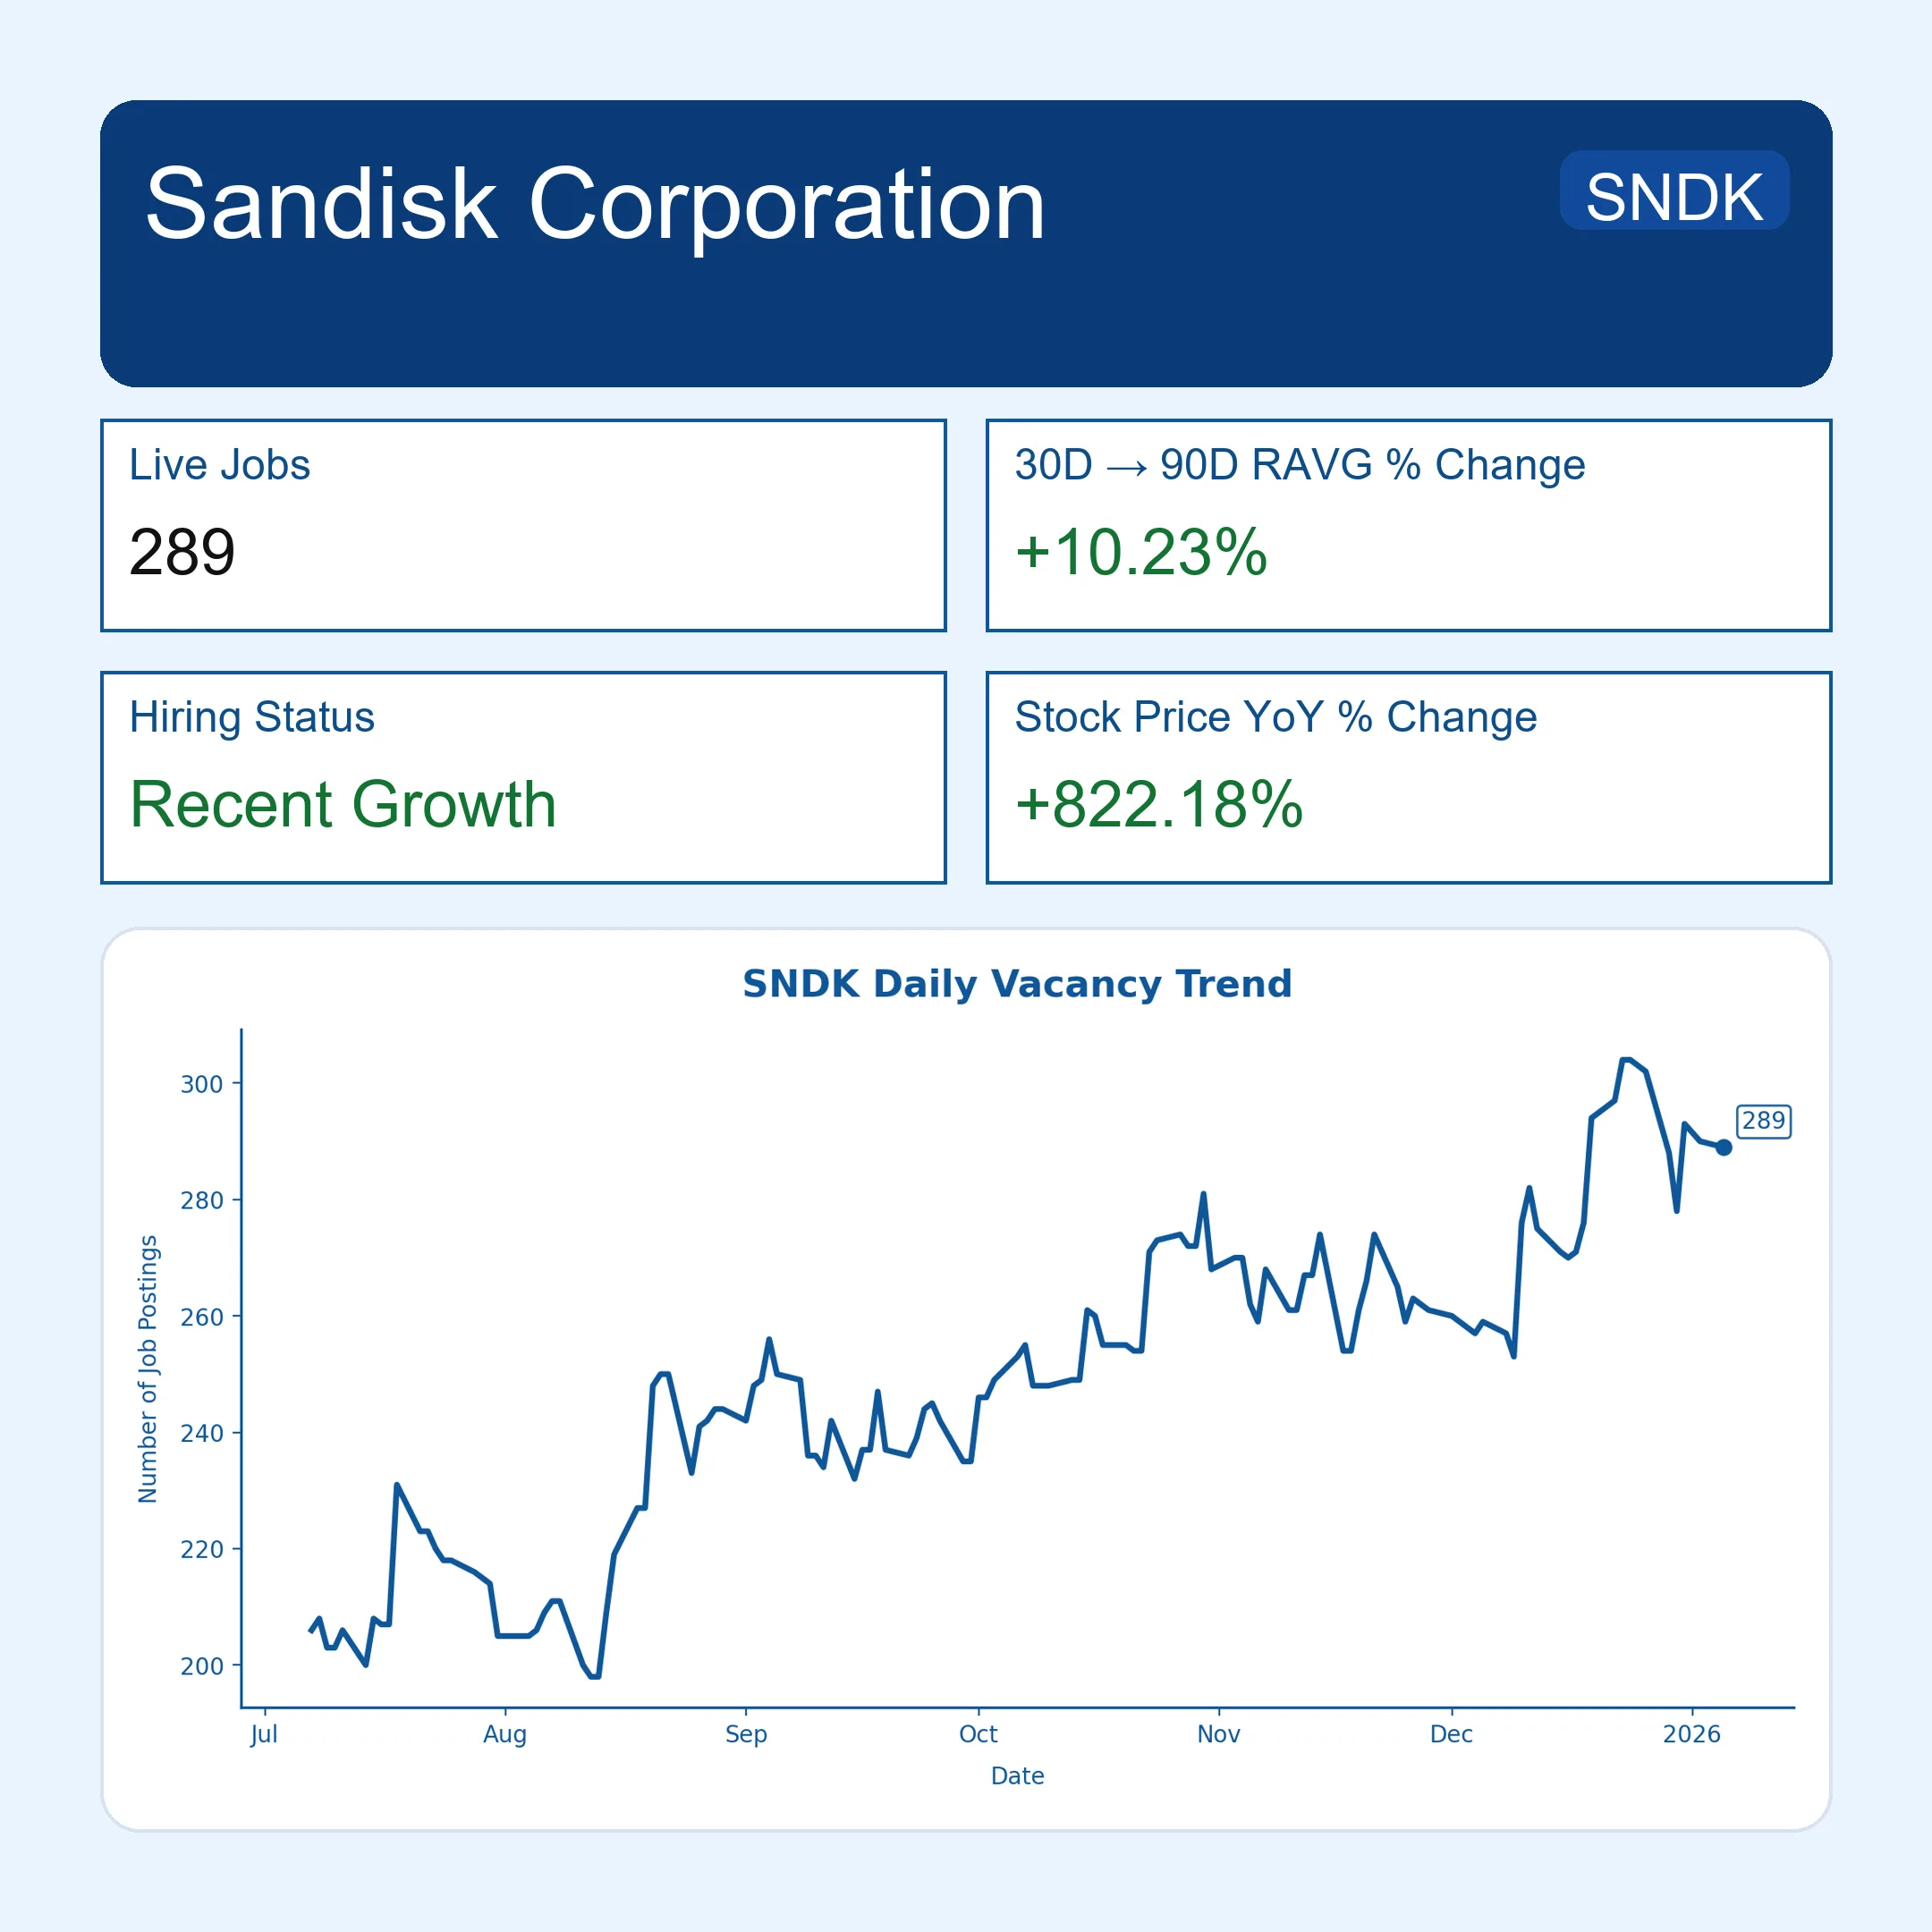
Figure 1: SanDisk hiring and stock performance snapshot
Western Digital followed a similar pattern, though with more turbulence. Hiring fell sharply early in the year after the spinout, then rebuilt through the second half. Live postings reached 238 by December, up more than 21% versus the 90-day average. The recovery mirrors the company’s shift toward enterprise and cloud storage, where demand from hyperscalers remained intact.
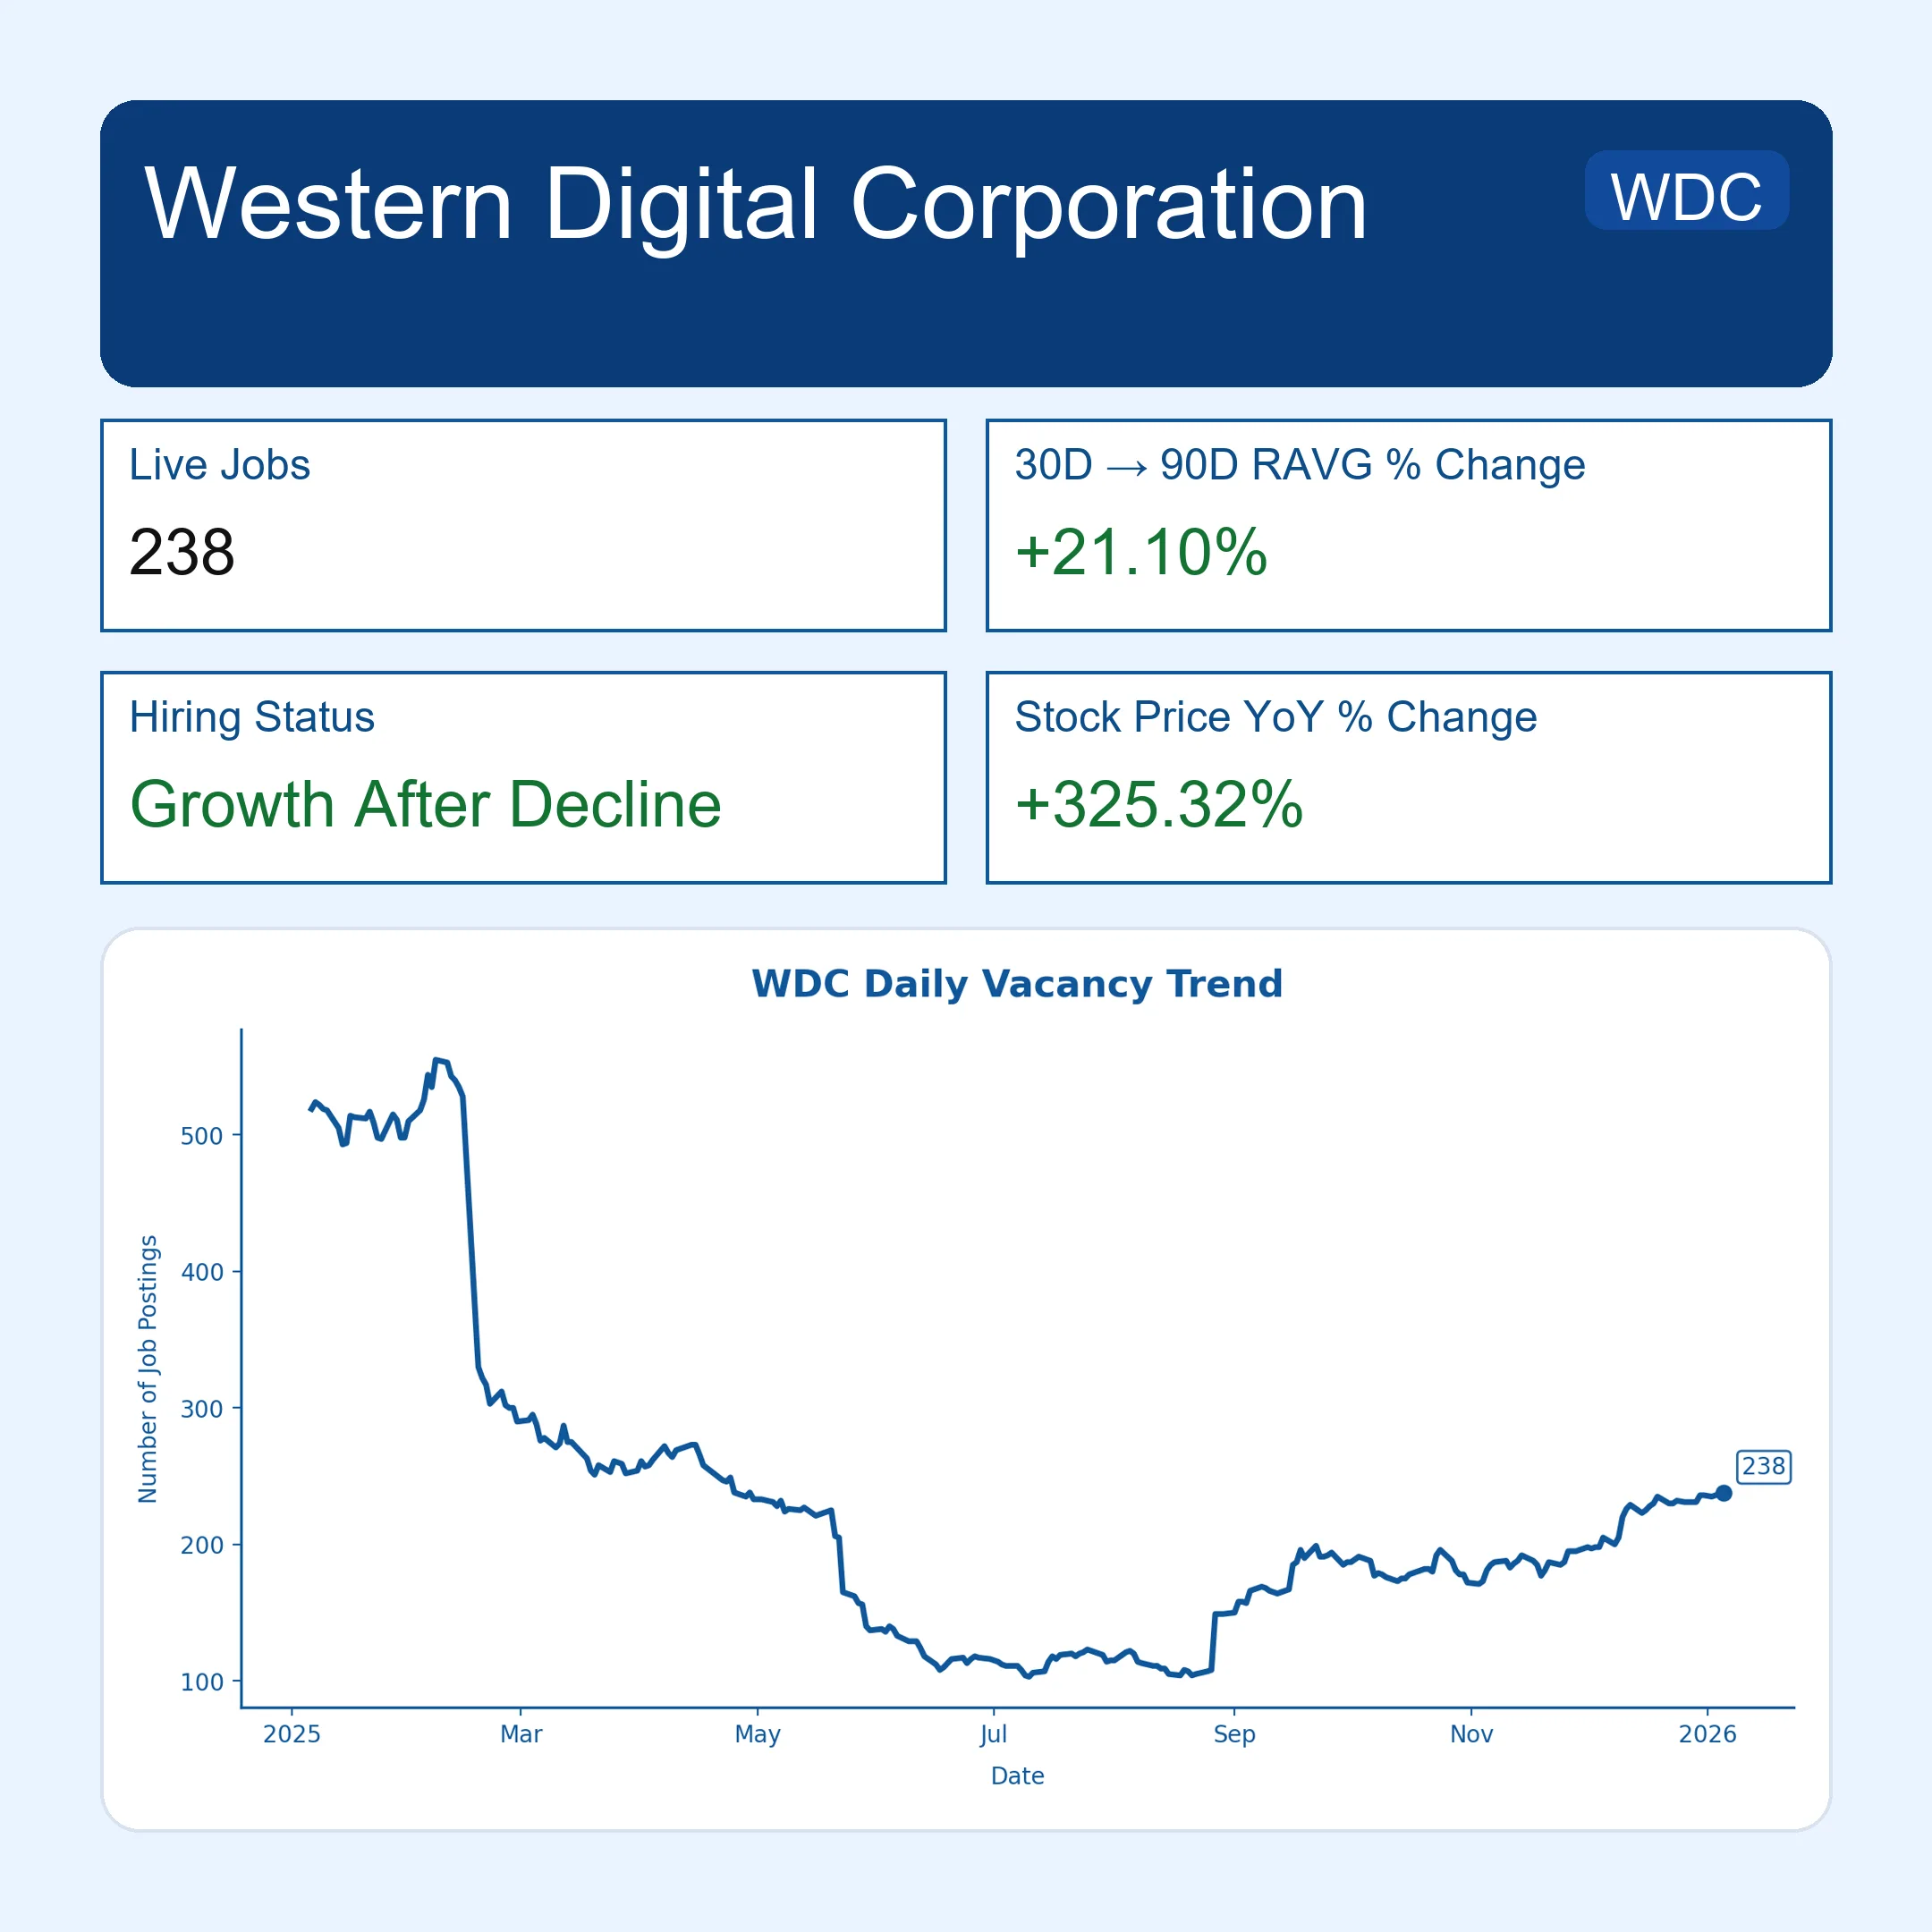
Figure 2: Western Digital hiring and stock performance snapshot
Seagate and Micron reinforce the same theme, but with very different hiring paths. Seagate’s hiring fell through the beginning of the year, then rebounded decisively as demand for AI-related storage accelerated. Seagate’s live roles climbed to 293 by year-end, nearly 5% above longer-term averages, following a sharp recovery in the second half of 2025.
Micron tells a different story. While the stock gained more than 230% YoY, hiring trended lower across most of 2025. That divergence reflects Micron’s multibillion-dollar investment in AI memory capacity, with growth driven more by pricing and utilization than workforce expansion. Job postings declined materially from early-year levels and, despite a late-year uptick, ended the year at 1,320 roles, still below where hiring began. The disconnect points to growth driven by pricing power and capacity utilization rather than workforce expansion, as Micron scaled AI memory output without rebuilding headcount at prior levels.
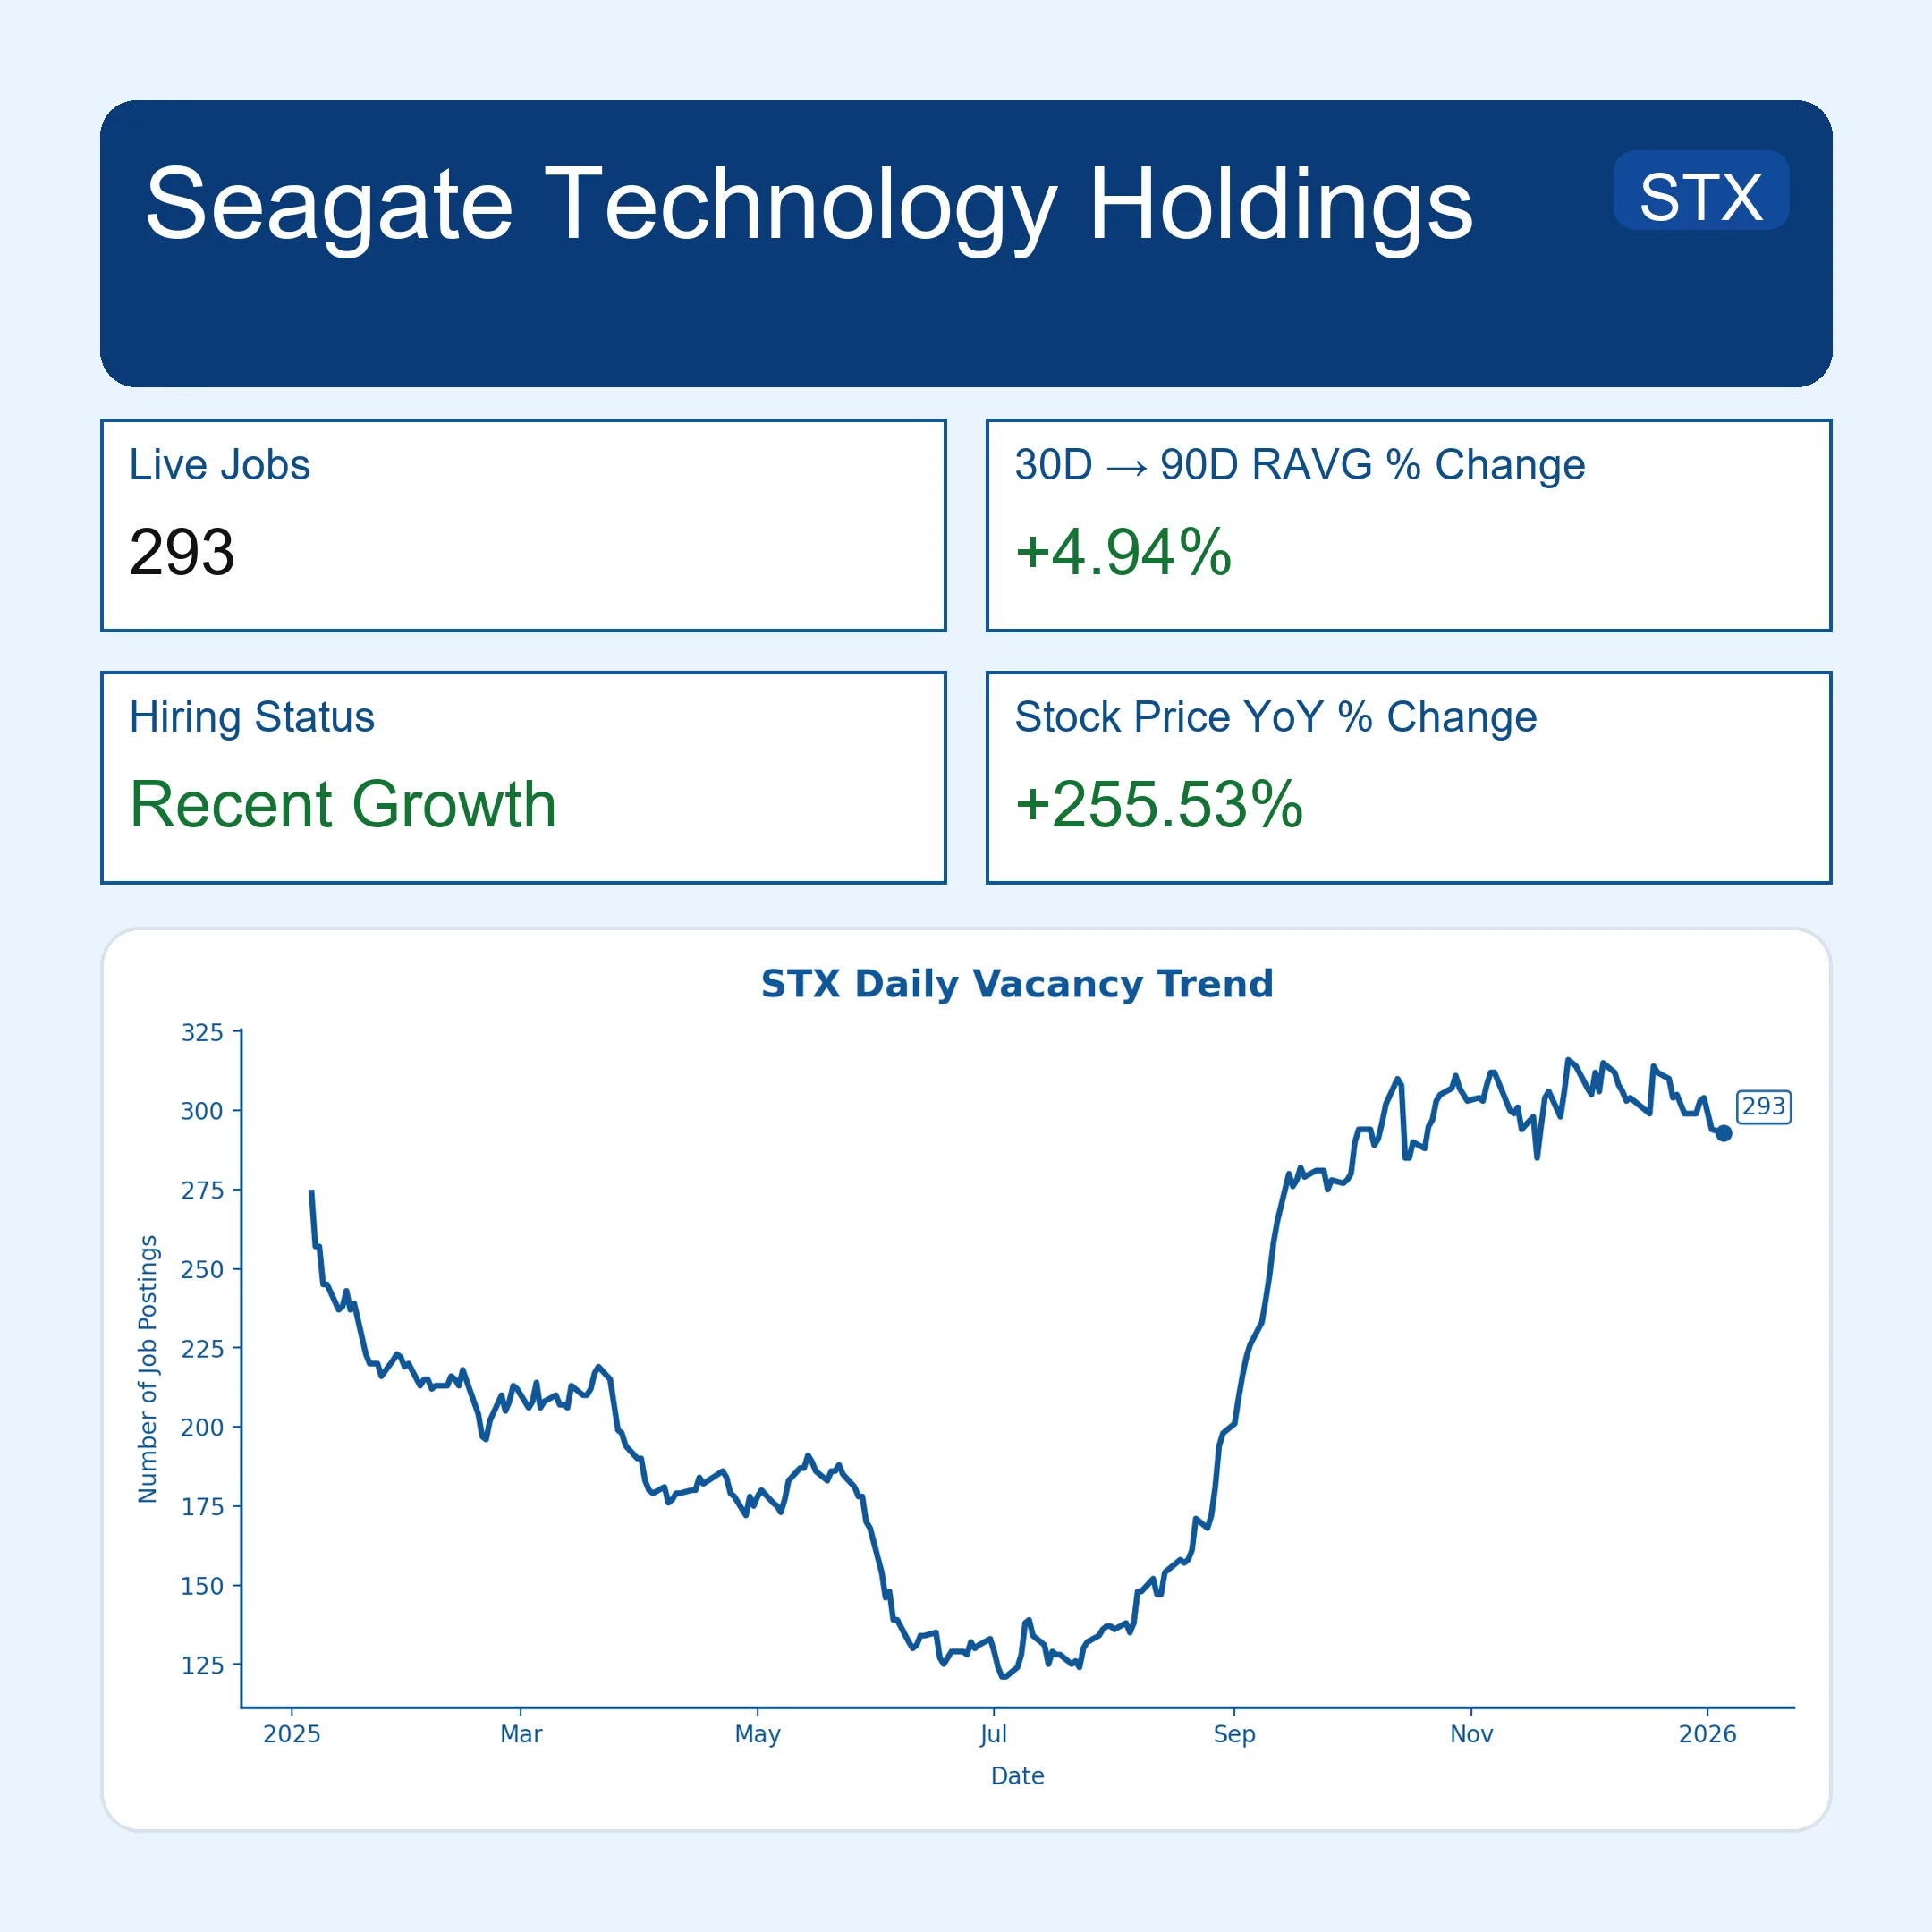
Figure 3: Seagate hiring and stock performance snapshot

Figure 4: Micron hiring and stock performance snapshot
When Share Prices Outpaced Headcount
Not all winners hired more.
Robinhood’s stock rose more than 180% YoY, supported in part by its international expansion into Asia. Hiring followed a different path. Job postings increased early in 2025 and fluctuated throughout the year, but ended December at 92 roles, roughly in line with where hiring began.
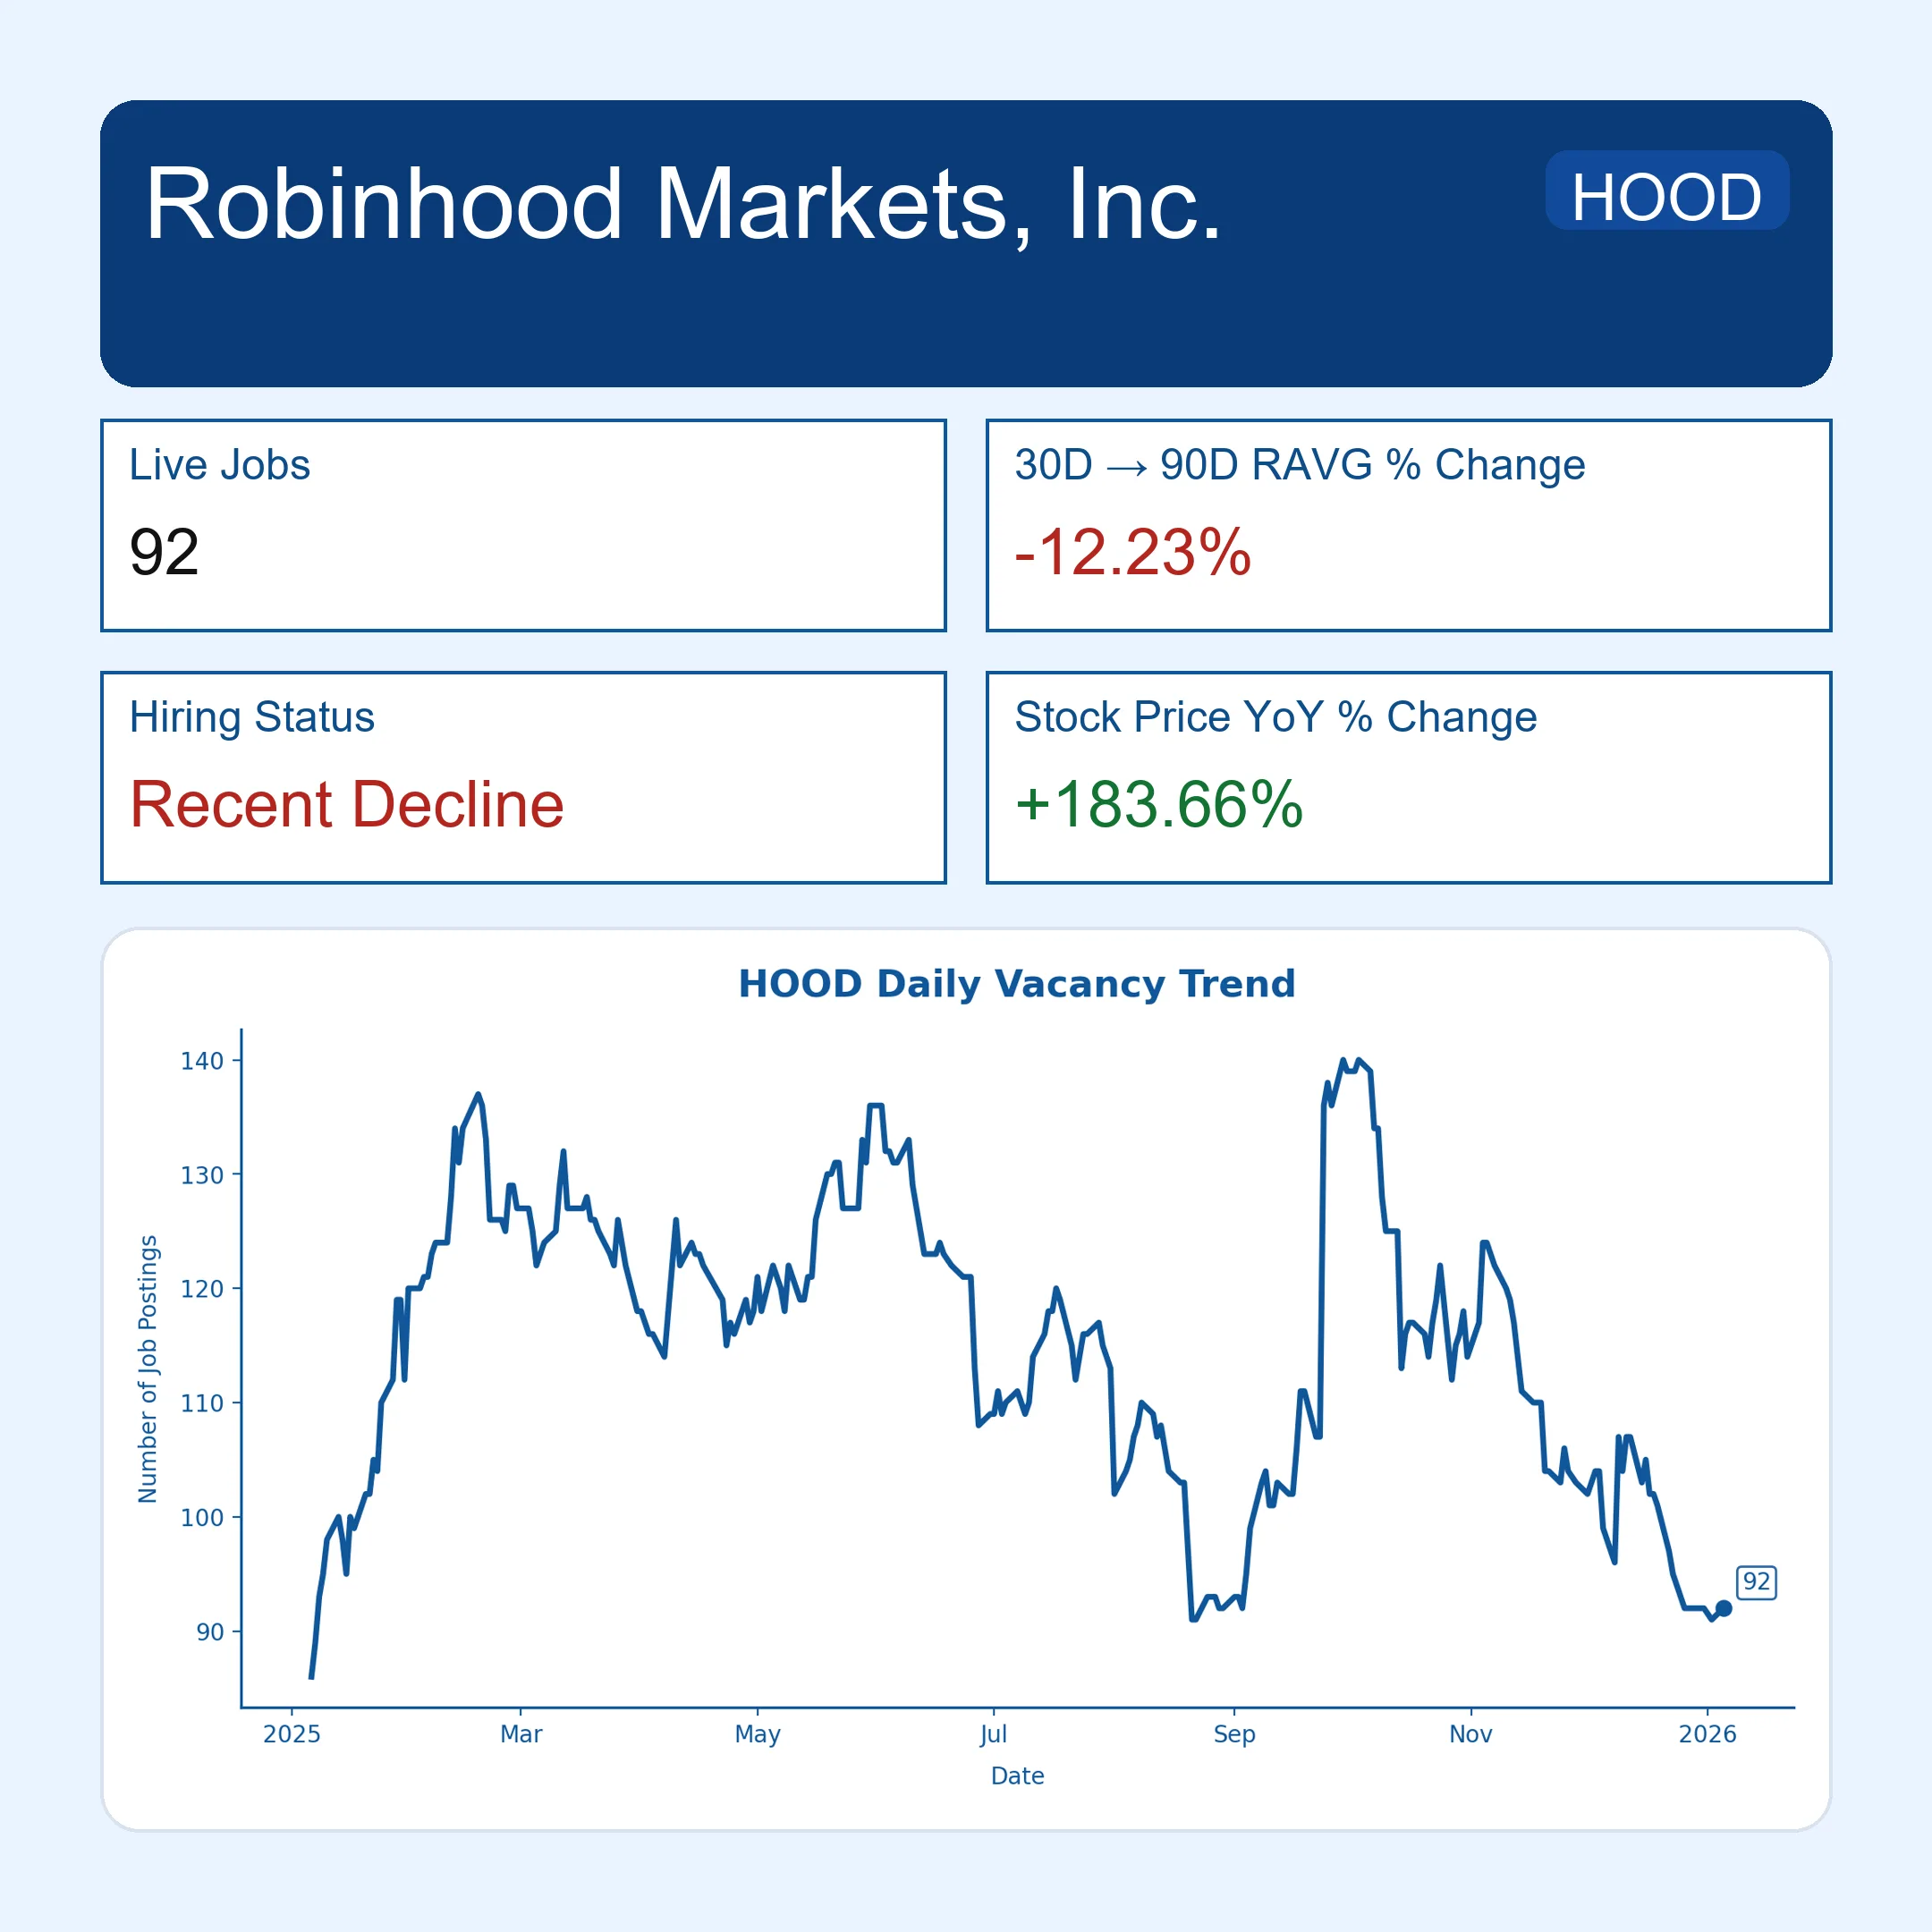
Figure 5: Robinhood Markets hiring and stock performance snapshot
For job boards, this distinction matters. High-profile stock performance does not always translate into higher vacancy volume, particularly when profitability improves faster than product scope.
Deep Declines, Deep Hiring Cuts
Among the S&P 500’s worst performers, hiring data shows far less ambiguity.
The Trade Desk recorded the steepest stock decline in the index, down more than 68% YoY. Hiring followed a steady downward path throughout 2025. The contraction reflects advertising platforms facing slowing brand spend, as outlined in company disclosures and market reporting. By year-end, live postings stood at 116, nearly 14% below the 90-day average, with no sustained rebound after midyear.

Figure 6: The Trade Desk hiring and stock performance snapshot
Fiserv shows a sharper break. Hiring expanded early in the year, then collapsed in the fourth quarter following an earnings reset and restructuring announcement. Live roles fell to 176, more than 46% below the 90-day average. The contraction reflects active retrenchment rather than seasonal softening.

Figure 7: Fiserv hiring and stock performance snapshot
Deckers Outdoor landed somewhere in between. Despite strong brand performance, shares fell nearly 50% YoY as tariff exposure and slower U.S. sales weighed on sentiment. Hiring eased steadily through the second half of the year. Live postings ended December at 241, roughly 13% below longer-term averages.

Figure 8: Deckers Outdoor hiring and stock performance snapshot
Signs of Stabilization Without a Rally
A few companies show early signs of operational stabilization even as share prices remain under pressure.
Gartner’s stock fell more than 50% YoY, yet hiring leveled off late in 2025. The slowdown coincided with a pause in corporate IT spending, contributing to flatter hiring through the second half of the year. Live postings ended the year at 674, slightly above the 90-day average. The pattern suggests a floor rather than a rebound, consistent with a strategy focused on margins and capital returns.

Figure 9: Gartner hiring and stock performance snapshot
Alexandria Real Estate Equities tells a similar story at a smaller scale. Shares remained down nearly 48% YoY, but hiring ticked higher. The decline followed weaker leasing demand in the life sciences real estate market, even as hiring showed early signs of stabilization. Live roles reached 21, almost 5% above the 90-day average. While modest, the shift stands out in a REIT sector still cutting back broadly.

Figure 10: Alexandria Real Estate hiring and stock performance snapshot
What This Signals for Job Boards
Looking across winners and losers, several patterns remain consistent.
Hiring expands when share price performance is tied to structural demand, particularly in AI and infrastructure. Recoveries driven by margins or pricing power, by contrast, tend to deliver limited hiring follow-through. And when equities suffer sharp drawdowns, hiring contractions usually persist well beyond the initial market move, with stabilization often appearing before valuations recover.
For job boards, the takeaway is familiar but increasingly important. Aggregate market trends explain less than employer behavior. Company-level vacancy data remains one of the earliest and clearest signals of where demand is returning and where caution still prevails as 2026 gets underway.
Data Methodology
The findings in this analysis are based on Aspen Tech Labs’ JobMarketPulse platform, which monitors hiring activity from more than 200,000 direct employer career sites worldwide. This dataset captures a substantial share of live postings and provides near-real-time insight into employer demand. All figures reflect information published directly by employers, including salary ranges where available. All data comes from posted job requirements; salary figures should be interpreted as indicators of market trends rather than confirmed offer amounts.
Until Next Time,
Julie “The Doc” Sowash
[Want to get Job Board Doctor posts via email? Subscribe here.]
[Got a tip, document or intel you want to share with the Doc? Tell me. Tip so hot you need it to be encrypted? Use Signal.]
Comments (0)