
The Groove Was Real. The AI Story Behind It Wasn’t So Clean.

The Q2 2026 recap covered the headline recovery: postings up 3.7% YoY, white-collar and tech-adjacent metros leading, AI Specialist postings up 94.8%. We asked our data partner Aspen Tech Labs to go back into that same Q2 JobMarketPulse dataset and check which of those numbers are actually an AI story and which just happen to be standing next to one. Here’s what they found.
You already have the top line from last month, so we won’t make you sit through it twice. U.S. job postings closed Q2 2026 at 6.45 million, up 3.7% YoY, tracked across more than 300,000 companies worldwide, including over 225,000 in the U.S., and a number of white-collar categories grew three to six times faster than the market average. What we want to spend this piece on is the question last month’s recap didn’t have room for: how much of that growth is genuinely an AI story, and how much of it is just sitting close enough to one to get credit. We’re setting aside AI Specialist’s 94.8%, the one title where the AI story doesn’t need defending, and pointing this piece at the categories that grew just as fast without an obvious reason why.
By July, all four categories had pulled even further ahead of the market, and that is exactly where they stop being one story. Two have a real, traceable thread back to AI infrastructure, though not an exclusive one. One only looks like a contradiction of its own industry’s numbers until you check what the category is actually measuring. One is a biotech story wearing a tech-sector nameplate.

Talroo brings clarity to improve new-hire retention
You filled the seat, but not with someone who plans to stay. The candidate made it through your entire interview process while quietly interviewing with other companies that pay 25% more.
When expectations aren't clear up front, retention suffers.
Get clarity up front with Talroo's SmartQualify.
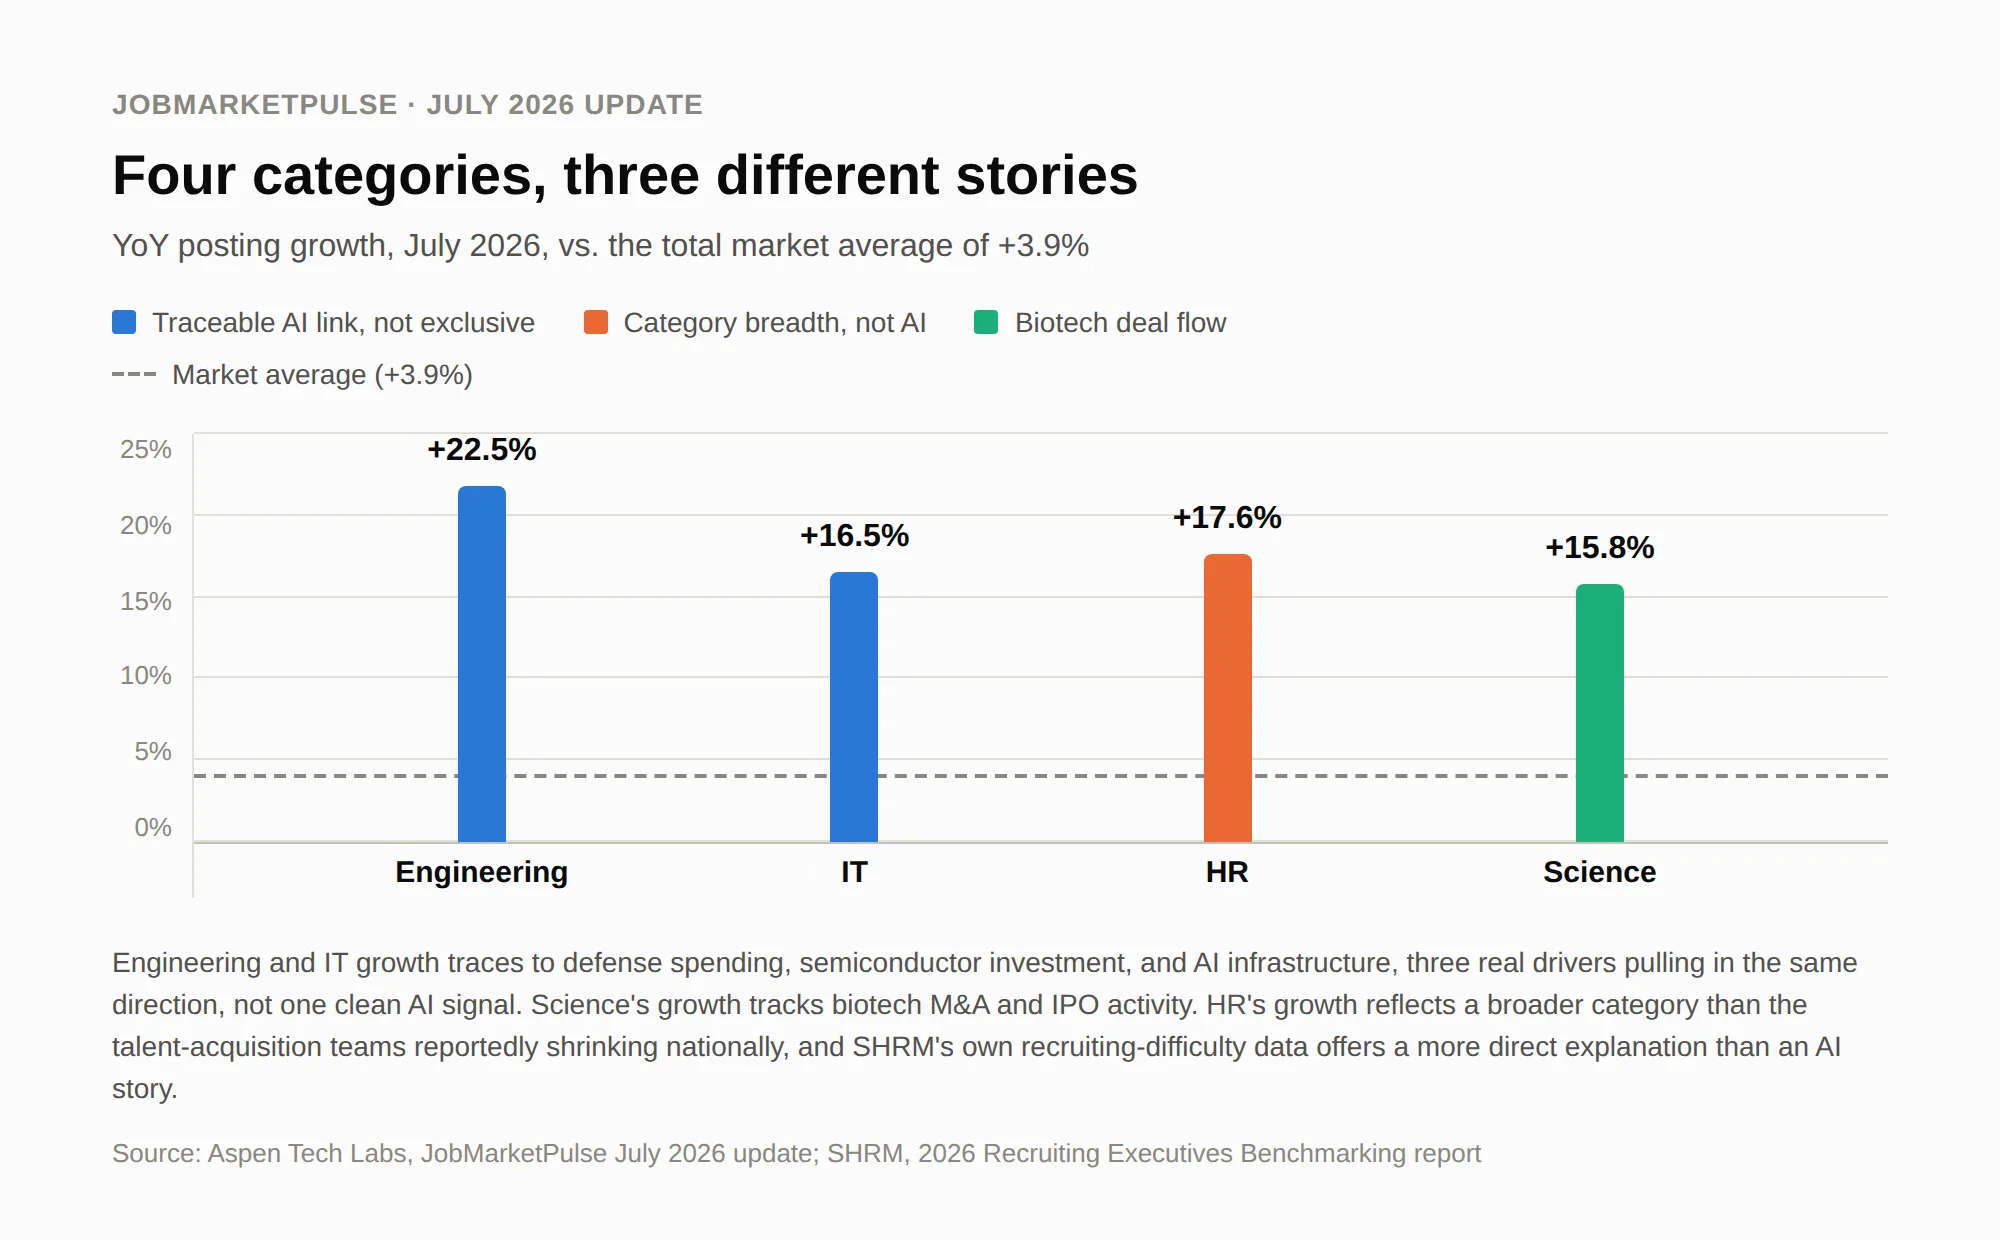
Figure 1: YoY growth for Engineering, IT, HR, and Science against the total market average
The AI Cluster Is Smaller Than the Headline Suggests
Engineering, IT, HR, and Science together account for roughly 391,000 postings, which works out to about 6% of the entire 6.45 million U.S. market. Even a wildly AI-driven surge inside that cluster is still a surge inside a fairly small room. If you are hunting for proof that AI is remaking hiring across the economy, our own postings data will not hand it to you yet. What it hands you instead is a concentrated bet inside a specific, still-modest slice of the market.
At least two of the four categories have a real, traceable connection to AI, though as the next section shows, that connection shares the stage with several other drivers rather than explaining the growth on its own. We wouldn’t rule out AI touching the other two, or categories well outside this cluster entirely; we just don’t have the paper trail for those yet.
Engineering’s Growth
Engineering postings rose 20.7% YoY in Q2 and kept climbing to 22.5% by July. It is tempting to file that entirely under AI infrastructure buildout, and infrastructure spending is a real piece of it. The Semiconductor Industry Association counts more than $820 billion in announced private U.S. semiconductor investment since 2020, projected to create and support over 525,000 American jobs, though only 71,000 of those are facility jobs inside the semiconductor ecosystem. Reshoring policy and national security priorities are pulling on Engineering postings alongside AI demand.
Postings data captures growth but not attribution. Treating the full 20-plus percent as AI-driven assumes a single cause the data does not establish. IT’s growth follows the same path for the same reason: it moves almost in lockstep with Engineering in Figure 1 because the two draw on the same pool of infrastructure buildout, chip investment, and reshoring dollars, not because IT has a cleaner AI story to tell on its own.
HR’s Growth
Here is the one worth sitting with for a minute. HR postings grew 15.7% YoY in Q2 and accelerated to 17.6% by July, putting them in the same growth band as Engineering and IT. Set that next to the widely reported contraction in corporate talent acquisition, and it looks like a paradox.
Our HR category spans payroll, benefits, HRIS, compensation, HR operations, and generalists, with recruiting as one piece inside it rather than the whole thing. The contraction story making the rounds is specifically about talent acquisition teams. SHRM’s reporting on the subject quotes recruiting-industry analysts describing TA teams shrinking alongside hiring demand, with repetitive screening and scheduling work moving over to AI. That is commentary from named practitioners rather than SHRM’s own survey research, and it is a claim about a narrower population than the one our HR category actually measures.
SHRM’s own research points the other way on what would actually move postings. Its 2026 Talent Trends Report found that nearly seven in ten HR professionals (68%) reported difficulty recruiting full-time employees, and 53% said recruiting has gotten harder than it was a year ago.
None of this turns HR into an AI story. It turns it into a category-definition story. A growing HR function and a contracting talent-acquisition function are different populations wearing the same department name, not two readings of the same number. That gap is worth holding onto because it comes up again later in this piece.
Science’s Growth
Science postings grew 14.0% YoY in Q2 and accelerated to 15.8% by July, tracking almost exactly alongside HR’s trajectory and just as easy to mistake for an AI category.
BioSpace’s reporting on Q2 2026 biotech hiring points to R&D postings surging 42% YoY in June, tied to a wave of mergers and acquisitions, 52 deals in the first half of 2026 compared with roughly 30 a year earlier, plus a rebound in biotech IPOs.
The Automation-Risk Bucket Refuses to Behave
Last month’s piece flagged Data Entry Clerk’s 10.0% growth as a reminder that being labeled at risk of automation and actually declining today are not the same claim. The fuller picture makes that sharper.
The World Economic Forum’s Future of Jobs Report 2025 projects role-level growth and decline through 2030. We pulled three titles and checked them against our Q2 postings. Cashier, which the report lists among the fastest declining, fell 1.1% YoY. Data Entry Clerk, on that same declining list, grew 10.0%. UI/UX Designer, which the report places among its fastest-growing roles alongside AI and Machine Learning Specialists, fell 14.9%.
One of three moved in the direction the report projects. The other two moved the opposite way: one grew where it was projected to shrink, and one shrank where it was projected to grow.
That doesn’t mean the framework is wrong. It forecasts where things may land by 2030, not what hiring looks like in any given quarter. The bigger point is that we shouldn’t treat a five-year forecast like a snapshot of what’s happening right now. Everyone doing this is making an educated guess, including us. AI could end up changing jobs that weren’t expected to be affected much, while having less impact on others. We can see that these three titles moved in the postings data. What we can’t say from the data alone is why.
One more wrinkle for anyone hiring in this space: the broader Creative category that UI/UX Designer sits inside grew 3.6% YoY, roughly in line with the market, even as the specific title inside it fell sharply. Aggregated categories are excellent at hiding exactly this kind of divergence, which matters quite a bit if you are benchmarking against a category number instead of the specific title you are actually hiring for.
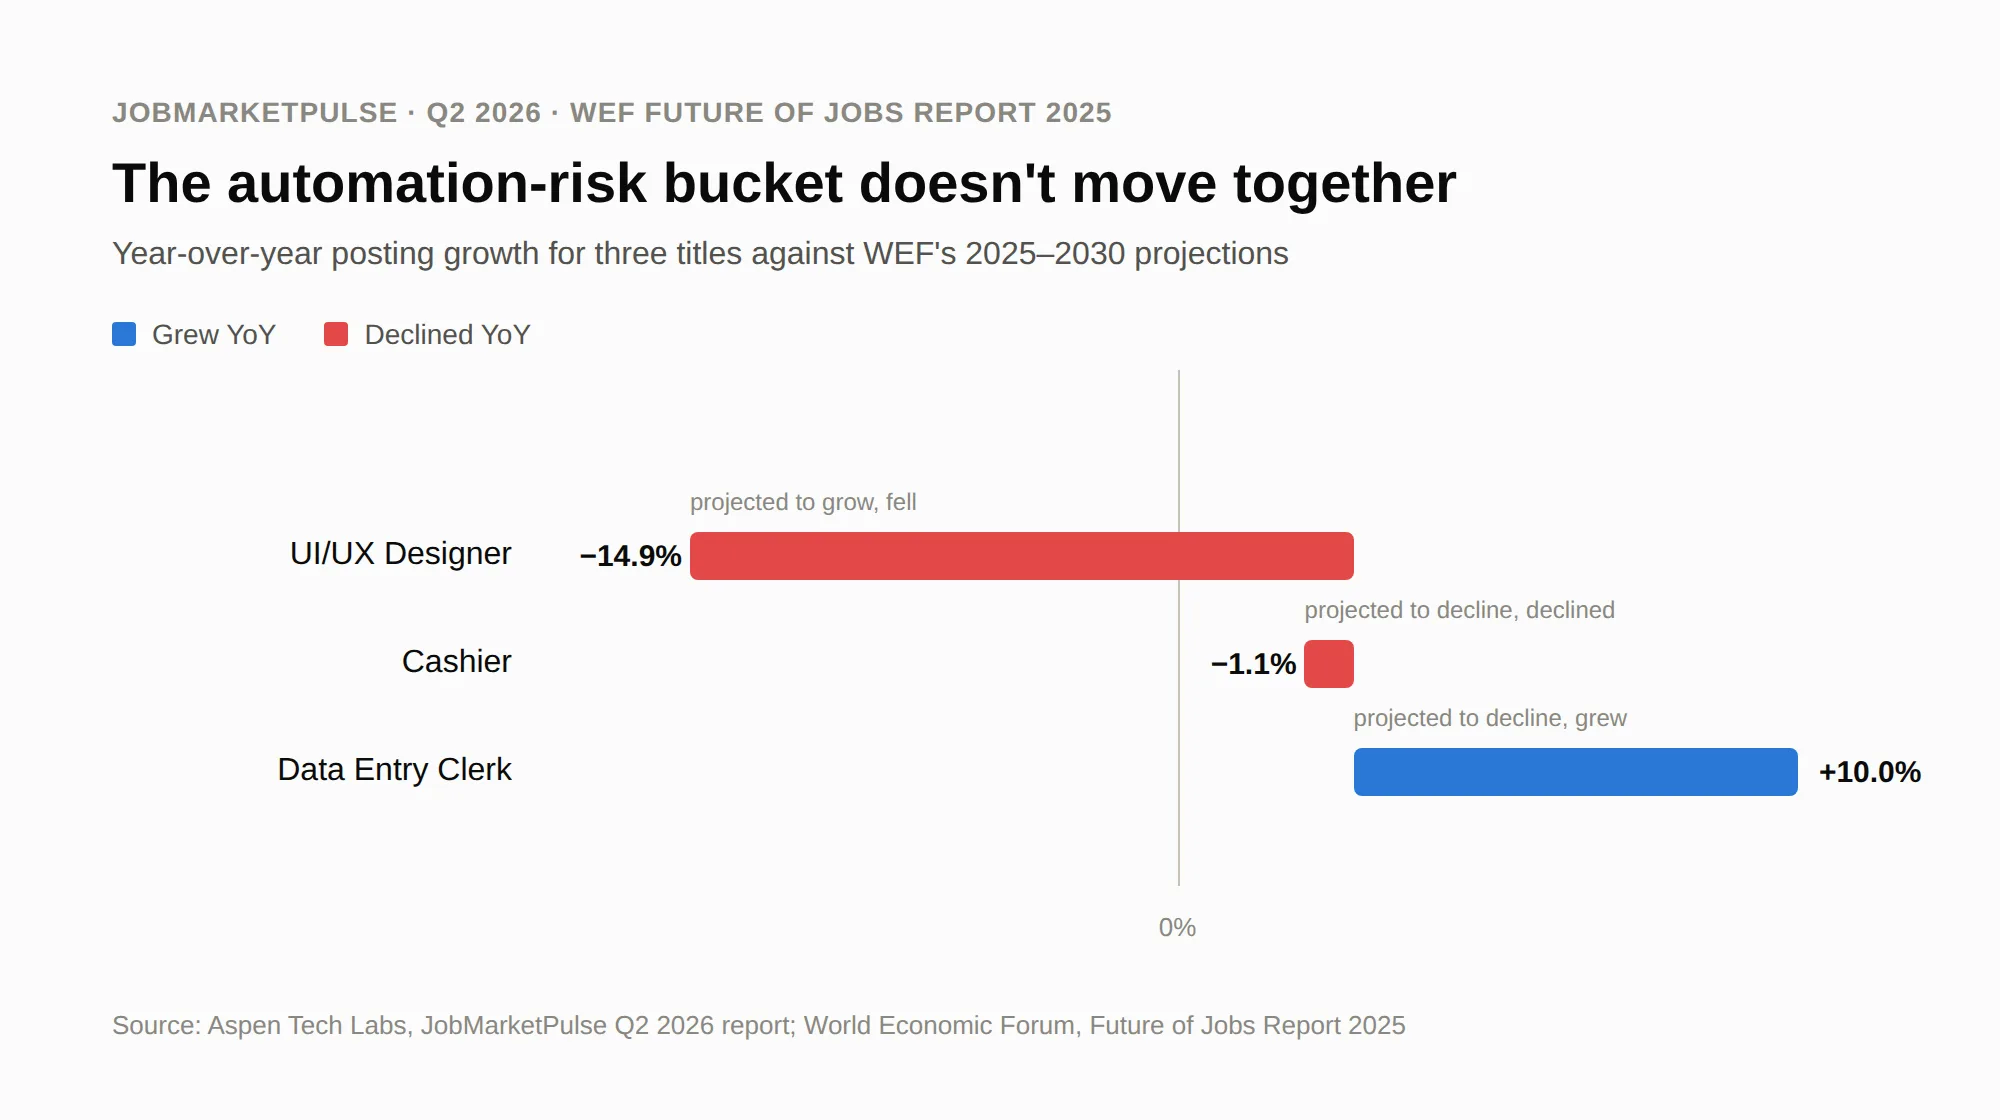
Figure 2: Year-over-year posting growth for three titles against WEF”s 2025–2030 projections
The Quiet Jobs Weren’t All Quiet
Civil Engineer, Agricultural Worker, and Social Worker are the kind of titles that get waved past in an AI hiring conversation: skilled trades and care work that everyone assumes still need a person in the room no matter what the models can do. Our own postings data mostly agrees, and then complicates that picture in one place. These are three sample titles rather than a full occupational category, so treat any single line here as worth watching rather than a verdict.
Civil Engineer fell 0.4%, and Agricultural Worker fell 1.9%, both close enough to flat that we would chalk them up to normal quarter-to-quarter noise. Social Worker fell 10.2%, a real move, and grant funding is the more obvious lead than anything to do with automation. Urban Institute research finds that two out of three nonprofits rely on at least one government grant or contract, and federal funding disruptions through 2025 have left a wide swath of human-services organizations weighing staff and program cuts, if they haven’t already made them. AI could still be touching this somewhere, but the funding explanation doesn’t require it, and one quarter of data on three titles isn’t enough to hang a trend on either way.
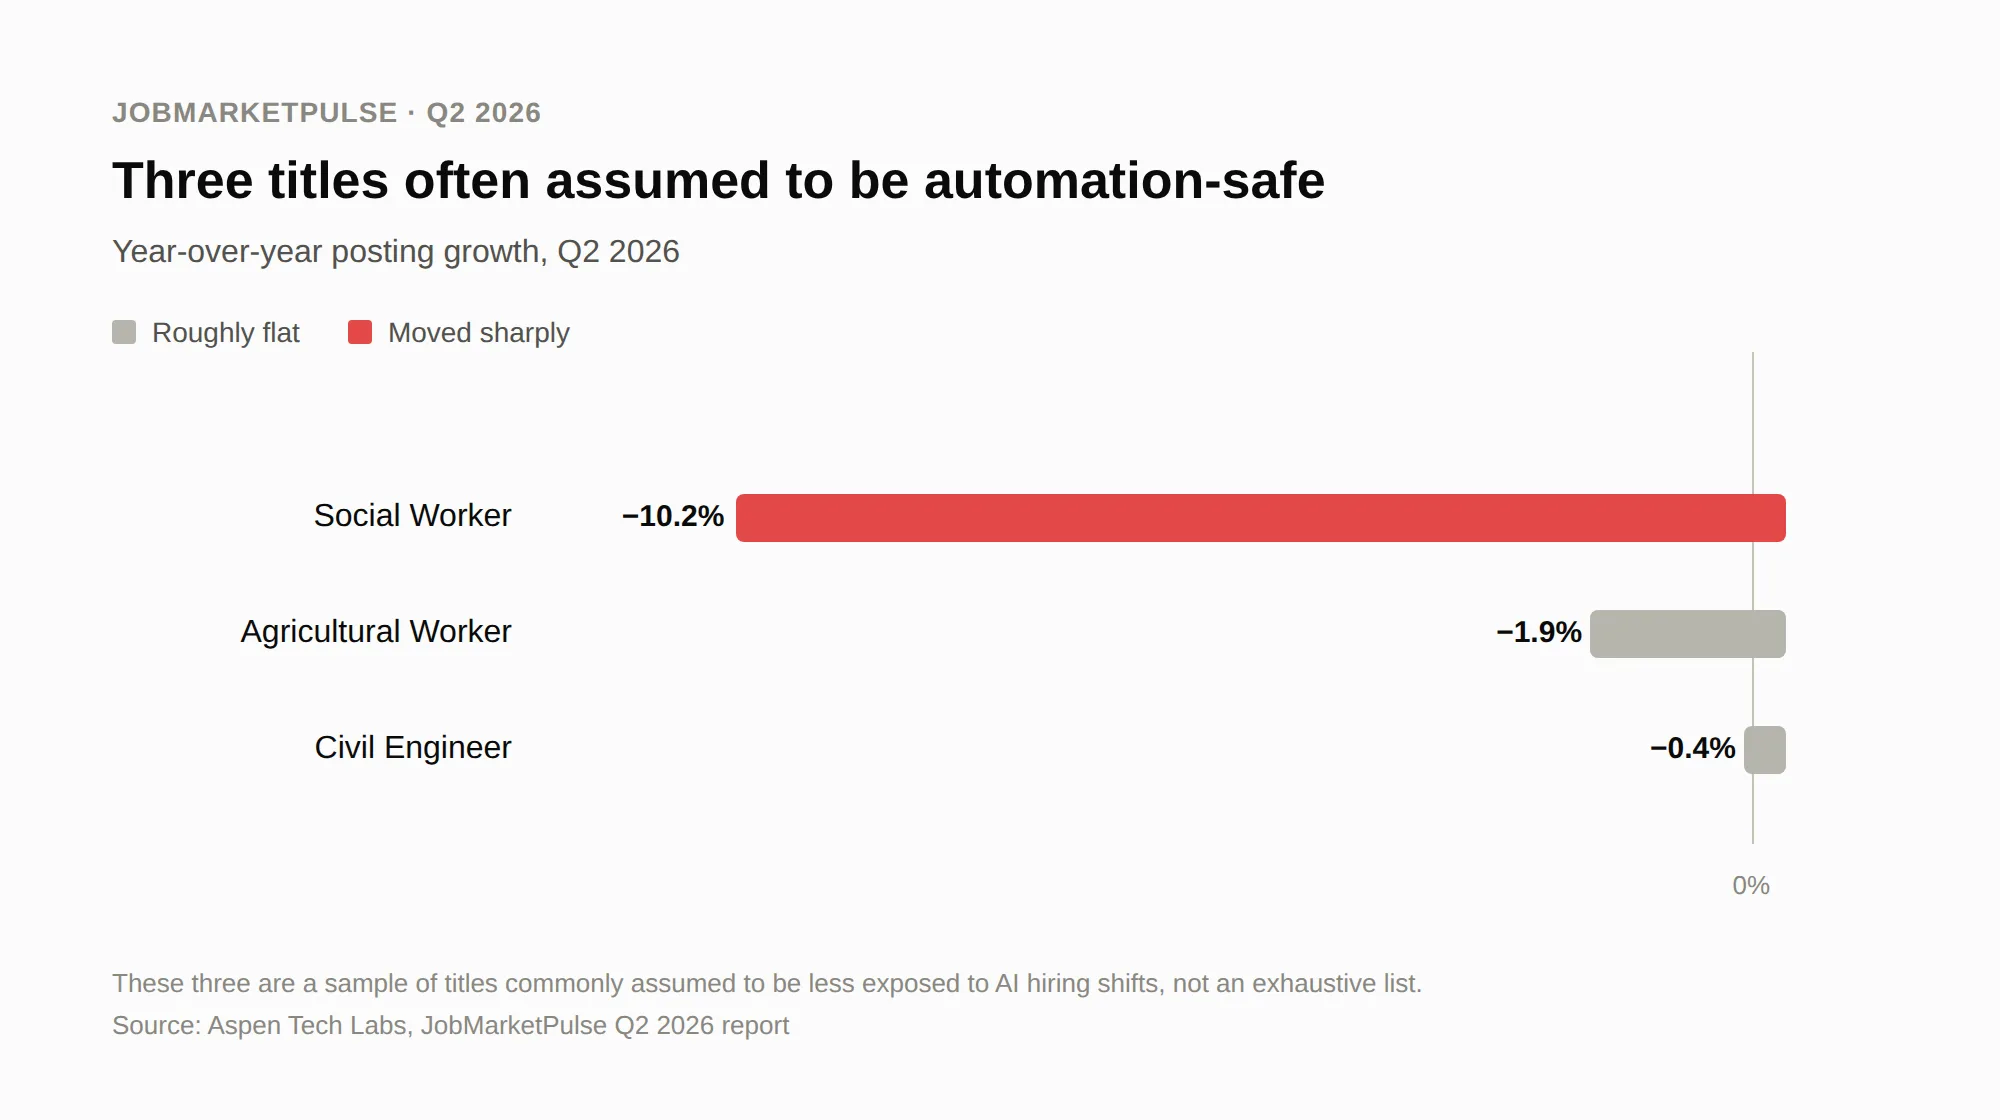
Figure 3: Year-over-year posting growth for three titles commonly assumed to be less exposed to AI hiring shifts
Software Developer Pay Swings Both Directions in 2026
Last month’s numbers included the eye-catcher: advertised Software Developer salaries fell 2.1% YoY in Q2, from $145,600 to $142,480, even as Engineering and IT postings kept surging.
Here is the other half of the story that did not make it into that piece. The same title had risen 4.7% YoY in Q1 2026, from $143,104 to $149,802, before flipping into the Q2 decline. Line those two quarters up sequentially instead of YoY and the swing gets sharper still: $149,802 down to $142,480 is a 4.9% quarter-over-quarter drop, a bigger single move than either year-over-year figure on its own.
There are a few possible reasons for this pattern. The simplest is composition. A surge this large in postings usually pulls in a wave of entry-level hiring, and adding junior roles to the mix brings the median down without anyone’s pay changing. The median moves because the set of jobs being advertised moved.
The second is bifurcation. Independent analysis of the 2026 software engineering market describes a friction-filled matching problem rather than a straightforward glut: hiring managers struggle to fill roles while job seekers struggle to get responses, and pay is bifurcating hard, with AI-specific engineering roles commanding a real premium over general software engineering ones. Our Software Developer figure covers a single title that employers apply across roles and specializations, inside a category that spans an even wider range. If Engineering and IT’s growth is concentrated at the specialized end, a flat median for the standard title next to a booming category is two different markets sharing one job title.
Finally, employers could simply be advertising less for the same work. A 4.9% drop in a single quarter is a real move, and pay compression in a specific slice of the market does happen. AI could be sitting behind any of these. It could be pushing more junior roles into the mix, driving the premium on specialized roles, or changing what companies think a standard developer role is worth. What we can say is that a swing that reverses direction inside six months is not behaving like a single durable cause, and that advertised medians move for compositional reasons often enough that we’d want to see where Q3 lands before making a firm conclusion.
Where This Leaves Us
Our own numbers support part of the AI-jobs story. A small set of categories with a real, traceable connection to AI are growing several multiples faster than a broader market that is recovering rather than collapsing, and even that connection shares credit with other drivers rather than standing on its own.
What the numbers don’t support is any tidy single-cause read. HR’s growth looks like a paradox until you notice the category and the contraction story are measuring different populations. Science tracks alongside a biotech M&A and IPO wave that BioSpace has documented. Software Developer pay moved in both directions in six months, and we can name three plausible mechanisms without being able to pick one. Two of three WEF-projected titles moved against their own projection.
None of this rules AI out entirely. It can plausibly be touching categories on both sides of this, the ones growing and the ones shrinking, and we’re not claiming a clean separation. What the data won’t support is treating AI as the whole explanation for any single one of them.
If you run a job board, a staffing firm, or a TA team planning for Q3, the practical takeaway matches the one last month’s piece landed on for the broader market. Treat the AI-infrastructure categories as a real but narrow signal rather than a stand-in for the whole labor market, and check title-level movement against the specific title you are hiring for rather than the category it sits inside.
Data Methodology
The findings in this analysis are based on Aspen Tech Labs' JobMarketPulse platform, which collects job posting data from more than 300,000 companies worldwide, including over 225,000 in the United States. Job postings are sourced exclusively from direct employer career websites and updated daily; recruitment agency postings are excluded from all trends unless otherwise noted. Salary data reflects advertised compensation extracted directly from job listings and may not represent final offers; figures are normalized across hourly, weekly, monthly, and annual pay rates. Job counts represent unique active postings per month, deduplicated and refreshed regularly, and the analysis excludes employer additions or removals resulting solely from improvements to Aspen’s data coverage. Changes reflect real shifts in hiring activity rather than database expansion or methodological updates.
Where does this align with what you are seeing on your boards or in your company’s hiring strategy?
I will be back next week.
Until Next Time,
Julie “The Doc” Sowash
[Want to get Job Board Doctor posts via email? Subscribe here.]

Comments (0)